

Micron Minute: This Is What The System Is Built For
Tracking the fundamentals of Micron is tough enough, tracking its chart tests all facets of my system.


This is why we wait, we watch, we confirm. The system relies on confirmation. The system provides the steps and levels to build the framework of the confirmation. And when things don’t go as expected in that confirmation, it confirms it’s not happening - it tells me when my expectation is wrong.
Last week, I outlined how Micron MU 0.00%↑ is setting up to move lower. But I had a path of how it had to move lower to confirm it would indeed reach the much lower target. Here’s how I set up the chart:
Once it [reaches the upside target in B], I’m looking for five waves down to start wave C, since C waves are typically five waves. If we see five waves down off the B wave high, followed by a three-wave bounce, that strongly increases the probability the stock is heading toward the $330 region, where the typical C wave target of the 100% extension is.
If instead we get only a three-wave pullback from highs, the possibility shifts toward the idea five waves up have already completed wave 1 of a larger rally. Right now, the magnitude of the moves off the low doesn’t give this a high probability, but if the share price proves otherwise, I’ll adjust as necessary.
Did we see five waves down off the high?
No!
We saw only three. Which put us into my other scenario: a larger rally.
However, that didn’t manifest either (at least not yet).
So, where does that leave Micron’s stock in the near future?
A larger B wave. In other words, more consolidation.
What the stock has now done is drop in three waves and rally in three waves. Generally, when this happens, it means the corrective move is ongoing and will take more time. This is not uncommon for B waves.
Practically speaking, Micron is likely to move relatively sideways for a lot longer than I was anticipating, and that’s OK. After a massive run like we’ve seen, a longer consolidation is pretty normal. However, the question of what it does once it resolves still looms large.
Let me walk you through my thought process on what has happened so far before trying to answer that question.
What first tipped me off we weren’t in the green C wave was the lack of follow-through to the downside right when it was supposed to happen. The move to the lows last week should have been the third wave of the third wave (the most prominent and swift of the waves). Instead, it tagged its target and proceeded to bounce above the resistance area, which is the 61.8% extension (I’ve noted it with the red line and text in the chart below).
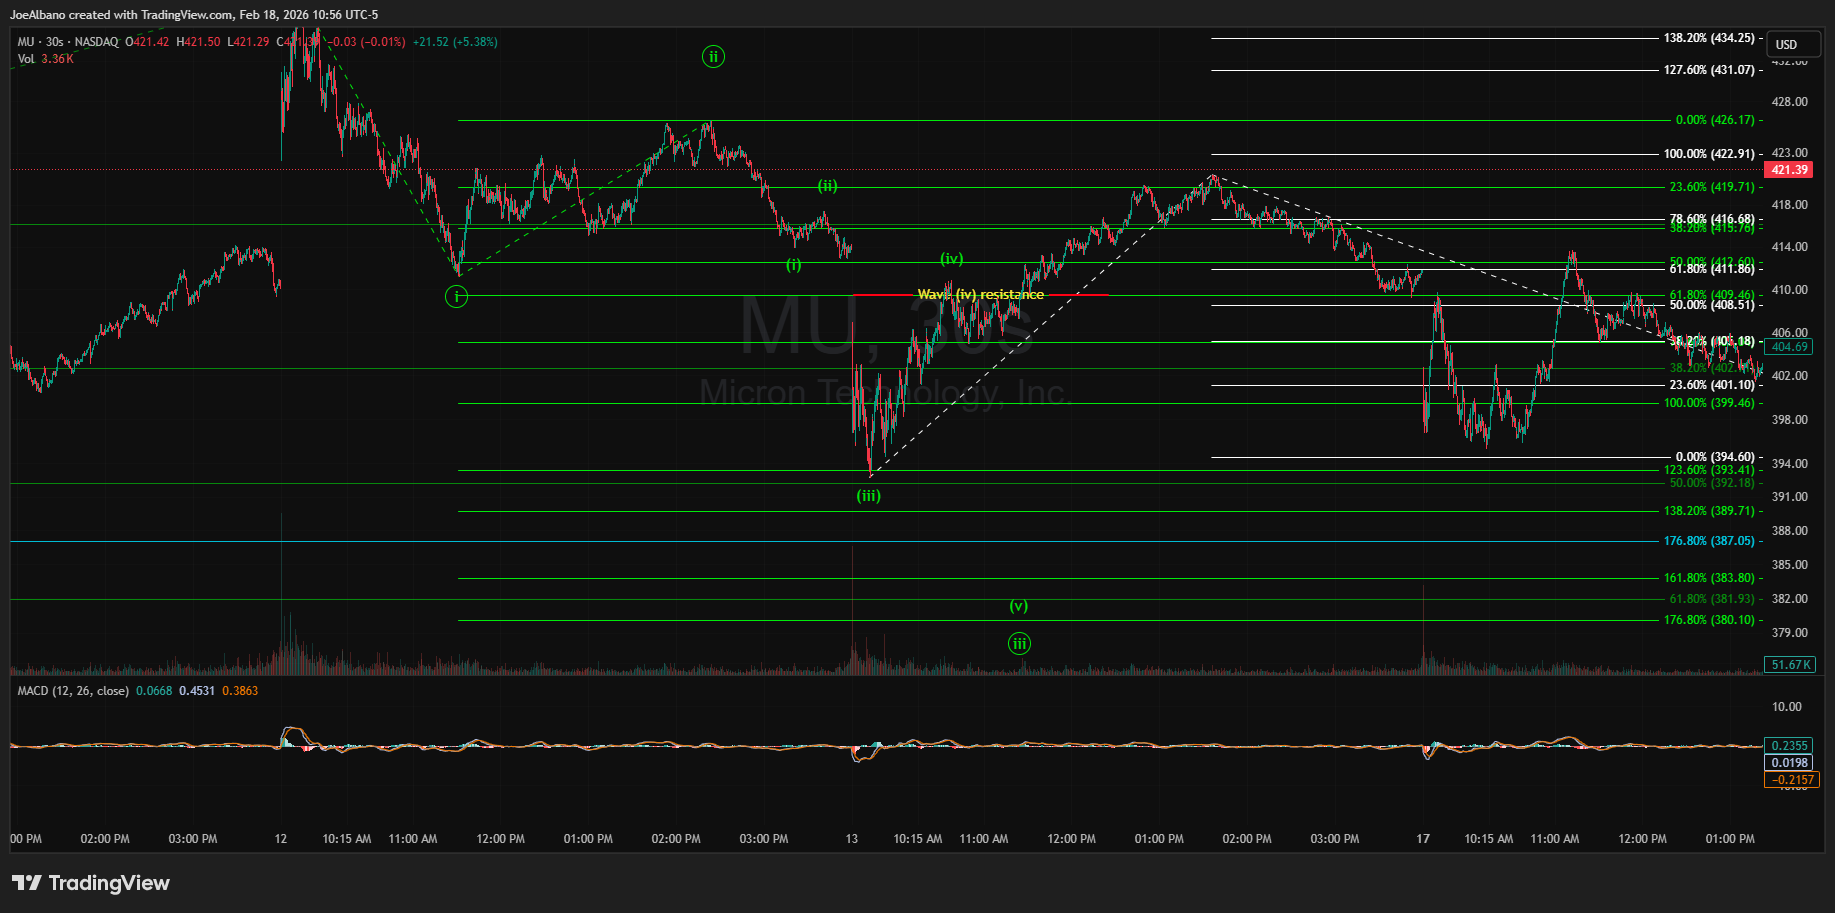
Once the stock moved above it, it became clear this wasn’t a full five-wave down move; it was only three. This signaled it was time to pivot and look at what may be playing out instead.
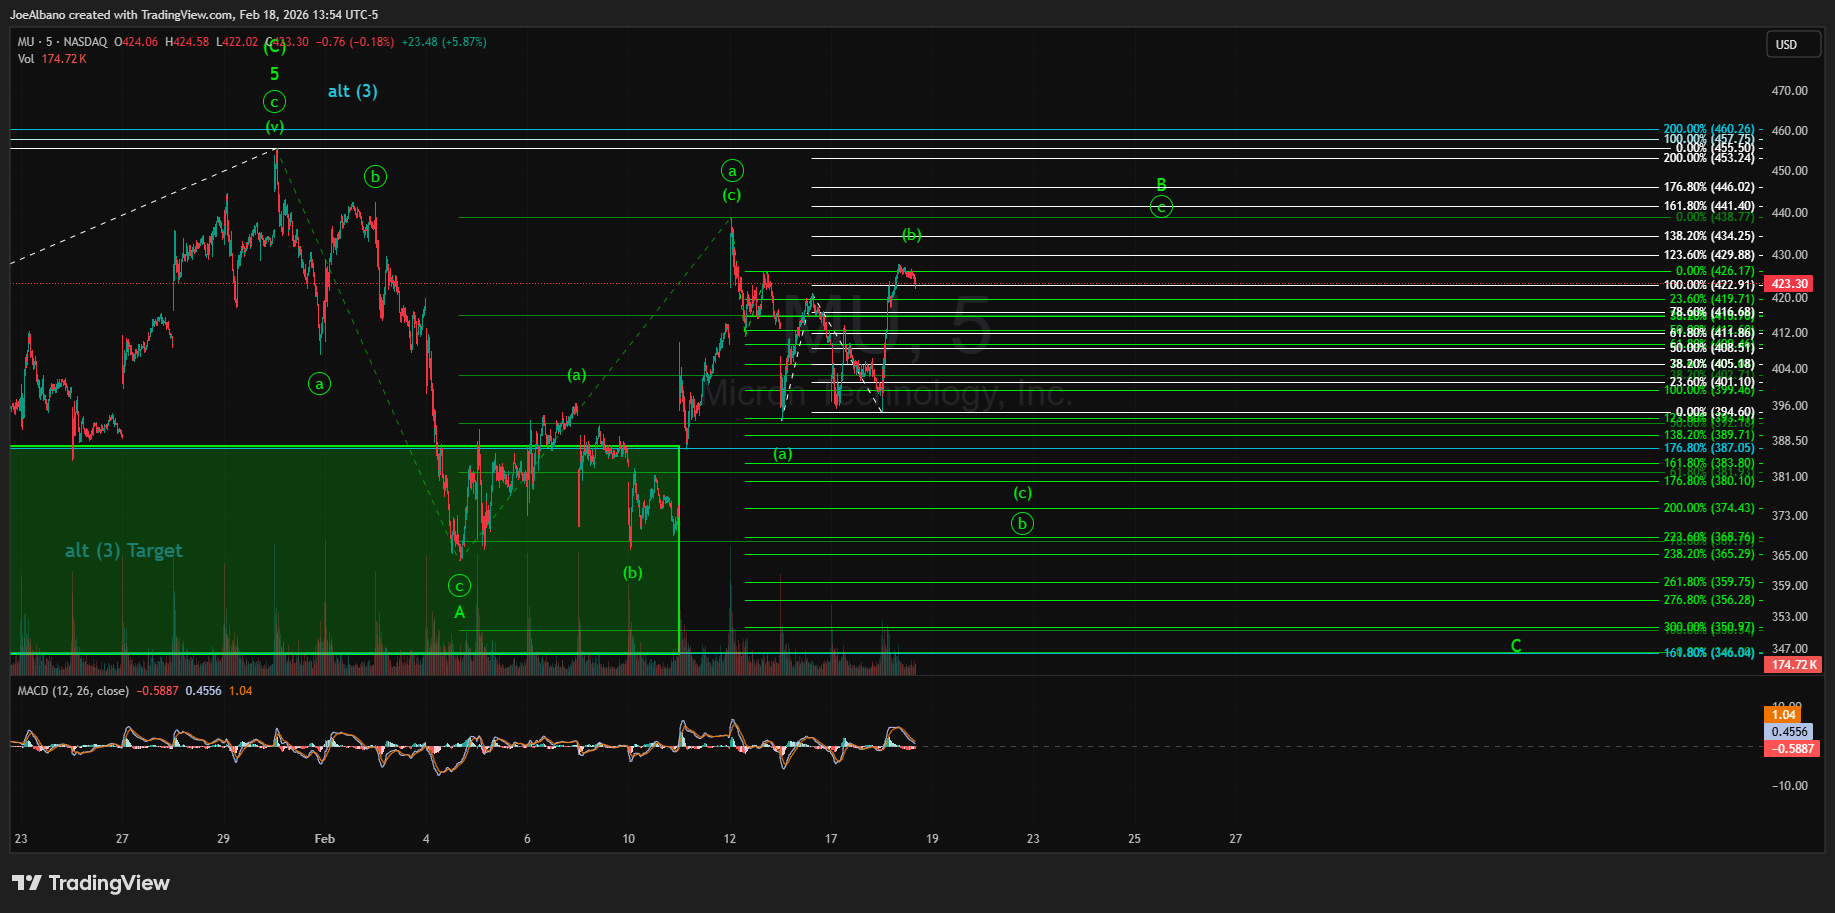
So, I evaluated whether my alternative scenario of five waves up was now starting with a wave three higher. However, there were a lot of problems with this scenario as the move off the early February lows didn’t appear to have five waves up. At best, it was three, and this pullback created a leading diagonal for a fourth wave. It wasn’t a clean count.
Therefore, given the additional price movement and the structure it has formed, we have a few new counts to evaluate and test along with a bullish alternative.
The first is a longer B wave forming. So instead of the C wave drop I expected right now, it would come later in this count.
The only concern I have with this count is the circle a was a deep enough retrace to be all of wave B. A more drawn-out B wave, as I now have it shown above, would mean some truncated extensions for circle c of B. This is one count.
Because we’re dealing with a B wave, which means we’re already in the middle of a corrective structure (A-B-C), these moves can go more than one way, so I have to have yet another count to track. This one says the C is starting now as I initially expected, but it’s going to be a much larger setup, where this is a i-ii setup to the downside. I have a more fundamental problem with this one because yellow alt (i) doesn’t count as five waves down, which a first wave typically is.
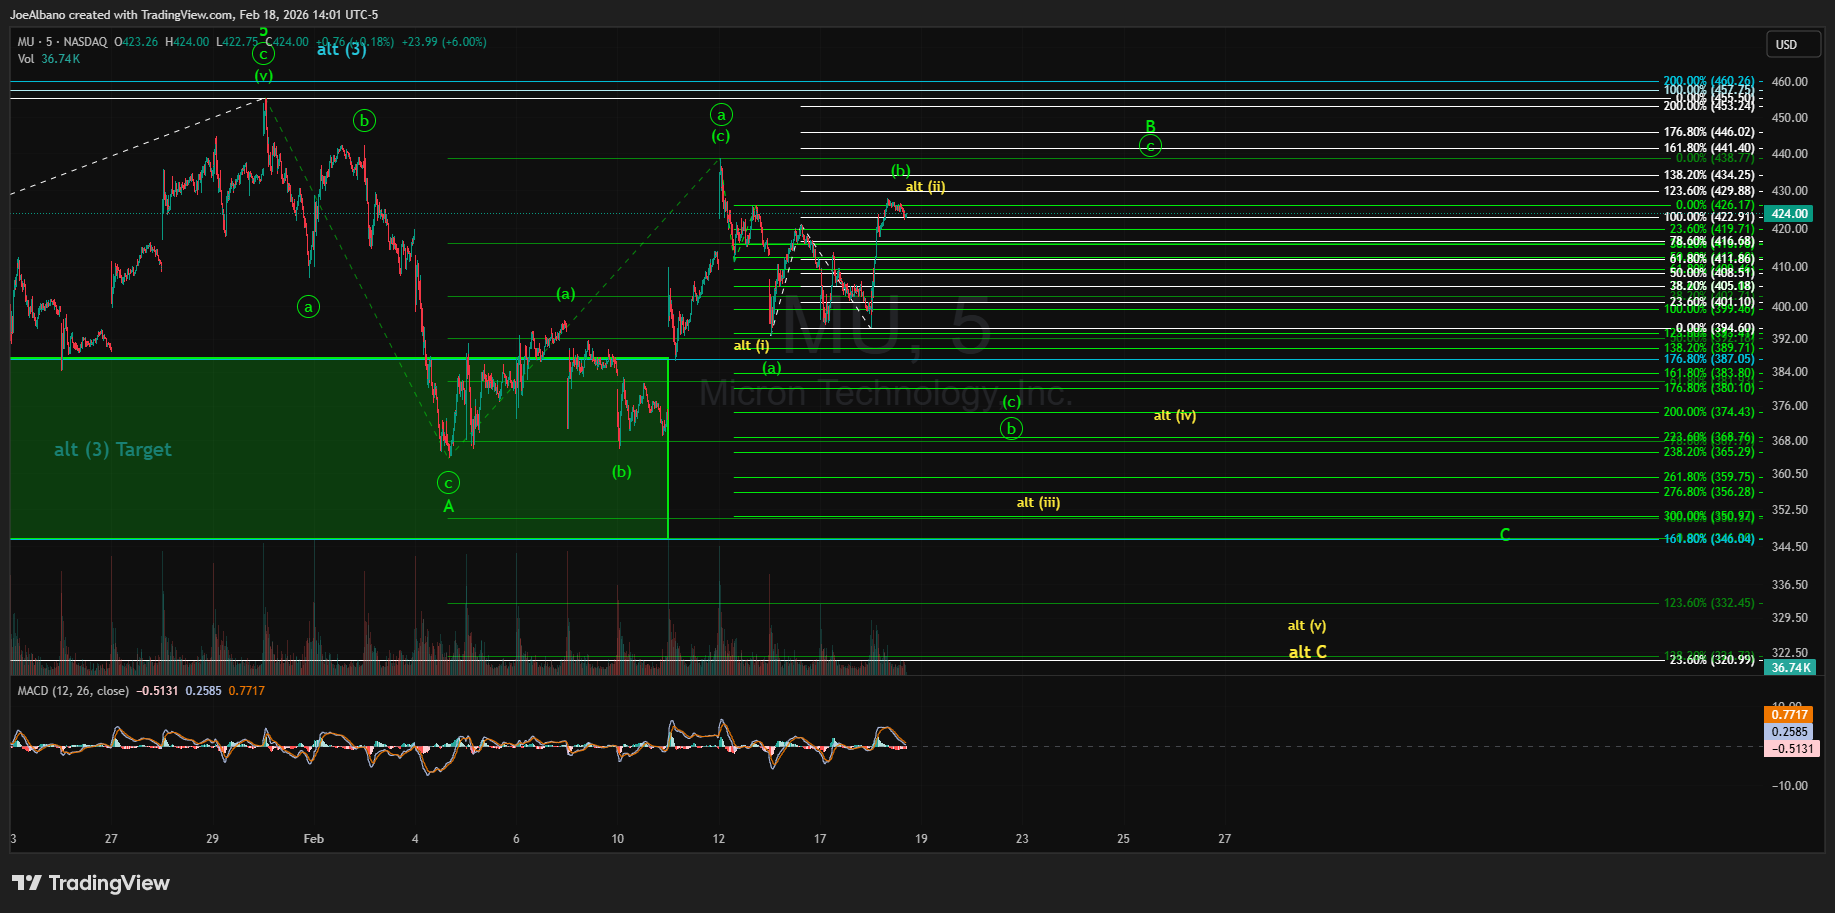
Nonetheless, this alt yellow count gets invalidated if Micron moves above $438.77, as a second wave can’t exceed the start of the first wave. And if that does happen, it actually sets up the (c) of circle b to be deep since it would be an expanded B wave inside circle b. Expanded B waves exceed the start of wave a (in this case, circle a) and then usually well exceed the 100% extension for the C wave later. That would align the green count much better for finding more typical targets.
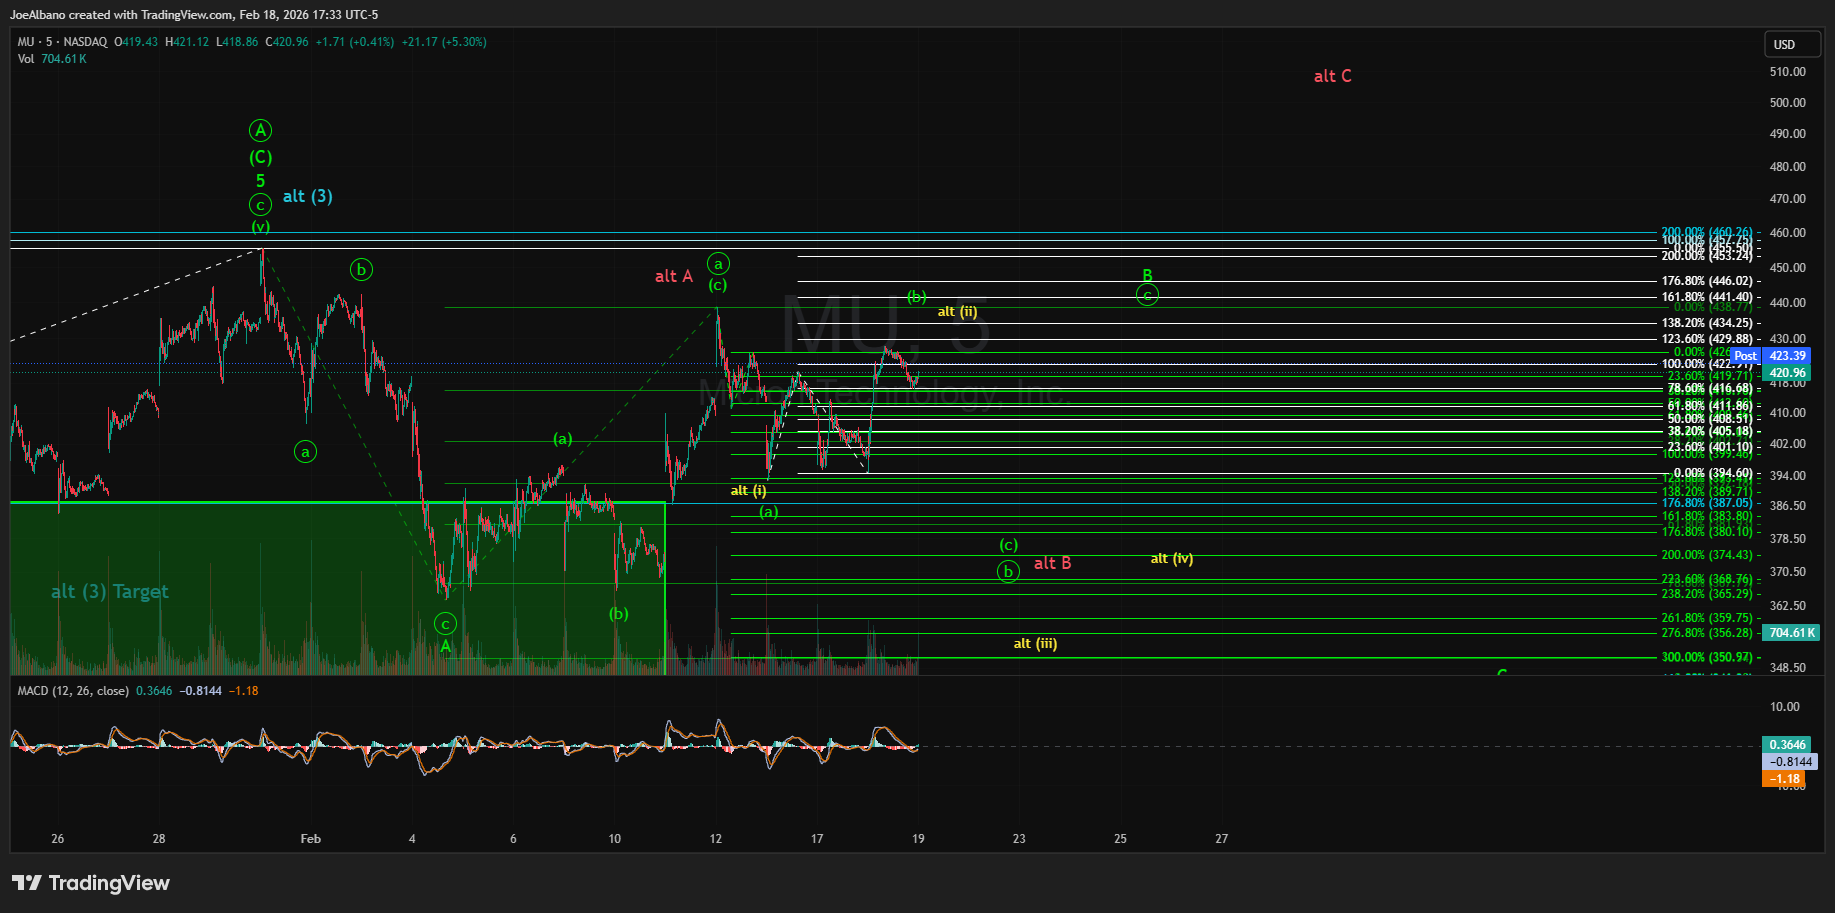
Finally, the alternative bullish count is the same concept I had from one of my earlier counts, with a three-wave rally to end this entire, almost year-long run (dating back to April of last year), except it is being delayed by what would be this larger B wave. You can see it below in red. It simply states this final rally will be a three-wave rally, which may be fitting considering the lack of good impulsive structure Micron has seen over the last several months.
The bottom line is three wave rallies and selloffs are not easy to track, as they don’t indicate trend direction. Therefore, there needs to be a lot of nimbleness right now to keep the pulse, as you’ve seen just in this article. When price action doesn’t follow through, it requires taking in the new price action and making changes to keep surfacing the highest probabilities. Perhaps by the end of this week, we’ll have a better idea of where the structure is pointing, but right now, there is no low-risk/high-reward edge for a near-term trade.
Trade With the System in Real Time
Founders Edition subscribers receive real-time Micron positioning inside the Tech Cache chatroom during the trading week, including:
• Live chart updates as structure develops
• Key levels, invalidations, and target zones
• Positioning adjustments as conditions change
• Coverage of other high-conviction tech setups
I am going to stay (I hate this expression) cautiously optimistic. It seems you are as well, due to the complexity of this one. Some how I don't think anything will show itself until after earnings. If it is not a crazy mic drop moment, you will more than likely be more than correct when sentiment takes over. Either way, do you think it will mean we are at the end of the business cycle, or with more time for the business side of the stock to stay range bound (much larger range of course). I seem to be in the latter camp.