

Solana vs. Bitcoin: Why Charts Point to Solana Leading the Next Rally
Solana’s latest breakout may set it apart from Bitcoin. Elliott Wave analysis and chart patterns reveal why Solana could lead the next crypto rally.


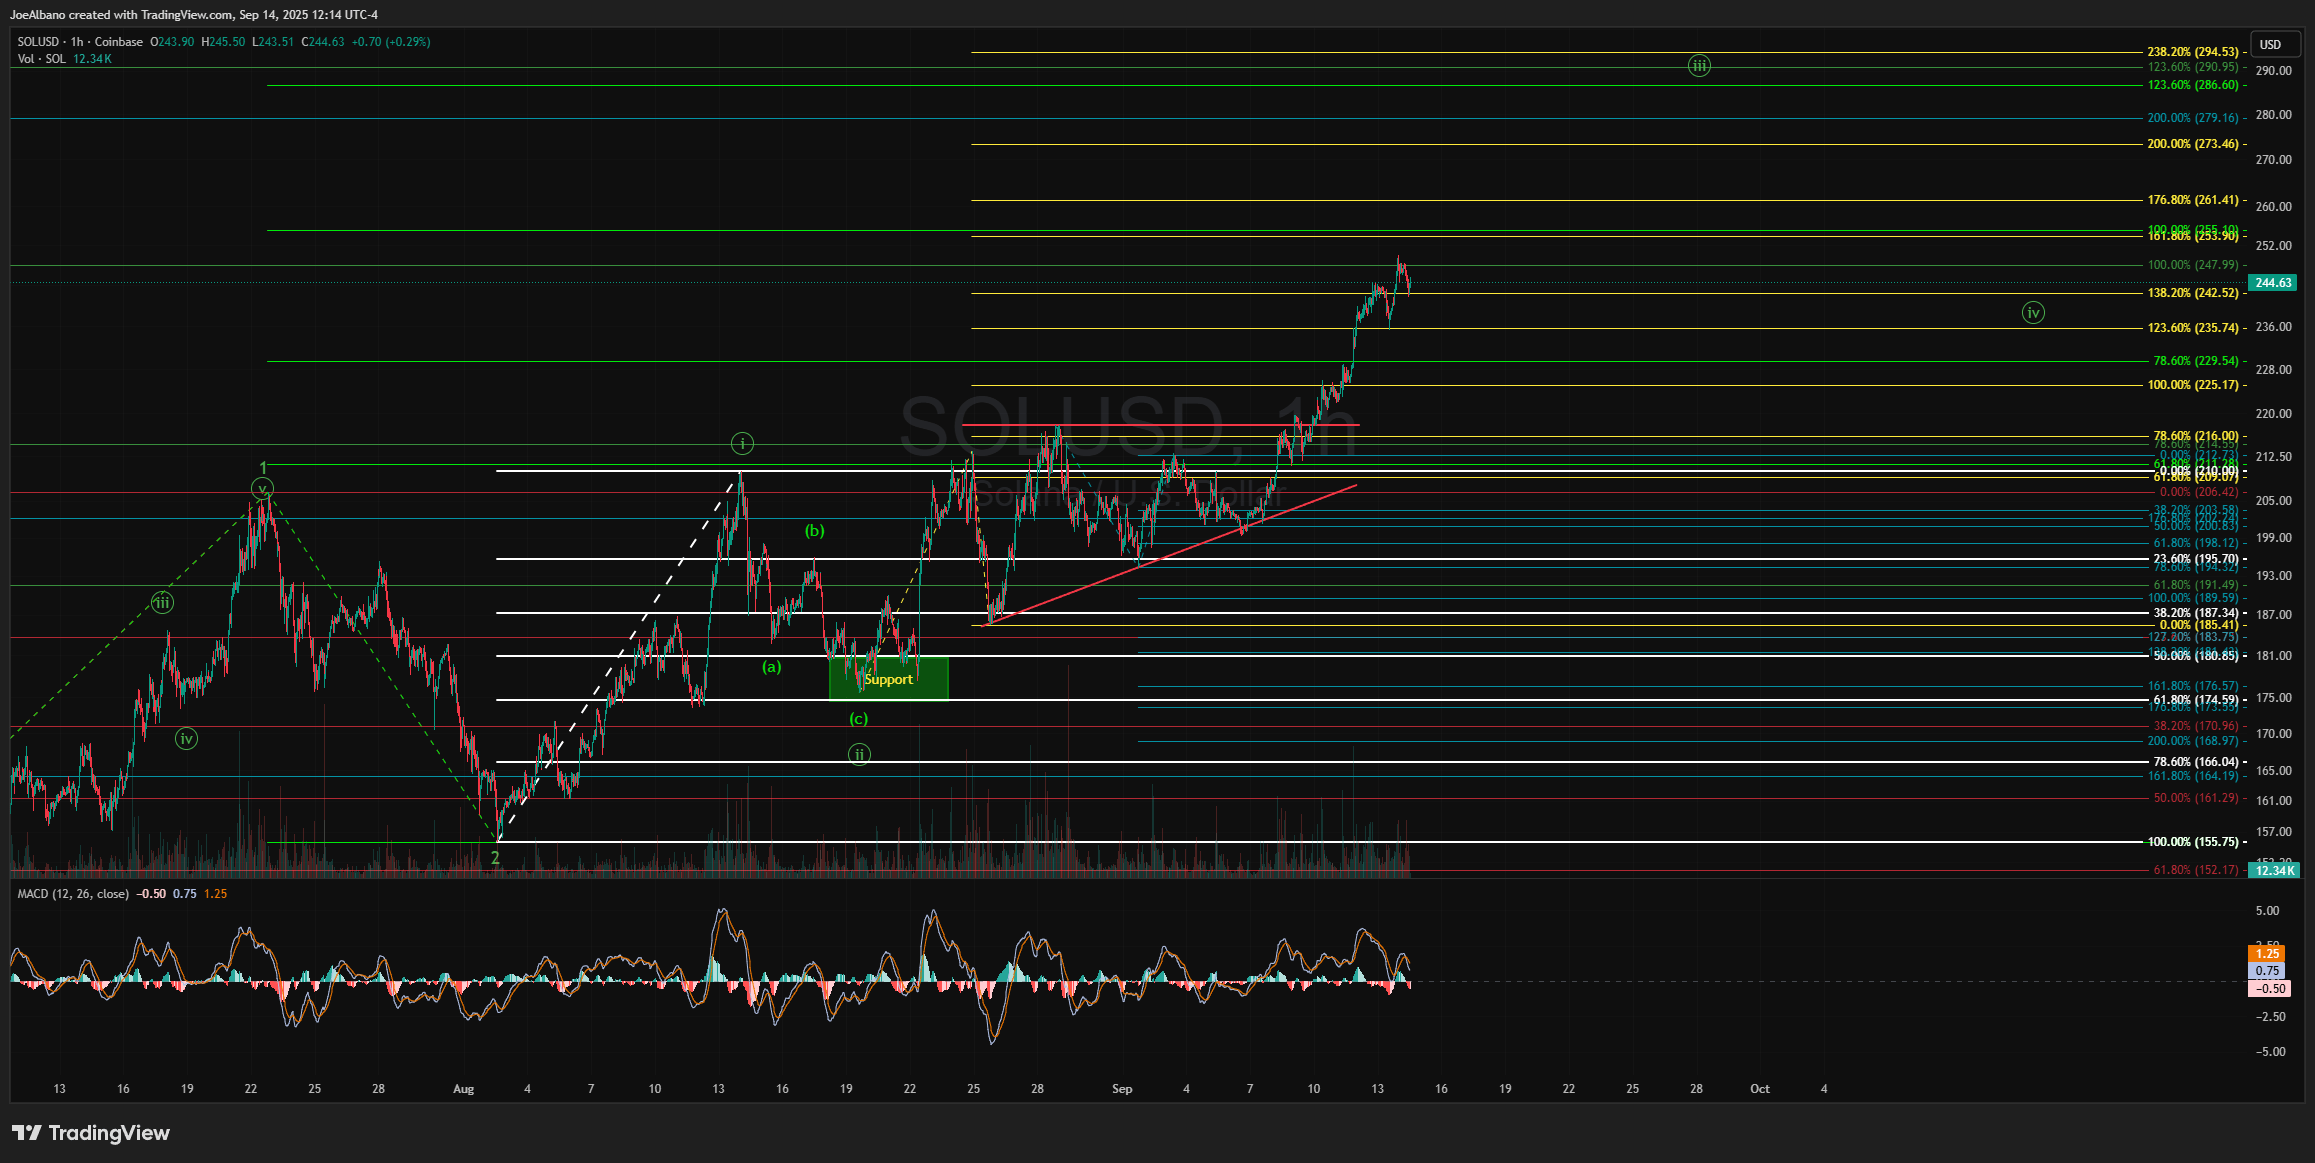
Solana's path higher has been fairly clean, but the move just before this recent breakout was questionable in terms of structure. However, I was able to combine traditional chart analysis with the Elliott Wave Theory analysis to get an idea something was truly in the works. With the move higher now well underway, I look toward our next targets, and as I do so, I look back to my Bitcoin analysis and see the percentage returns for Solana will beat Bitcoin.
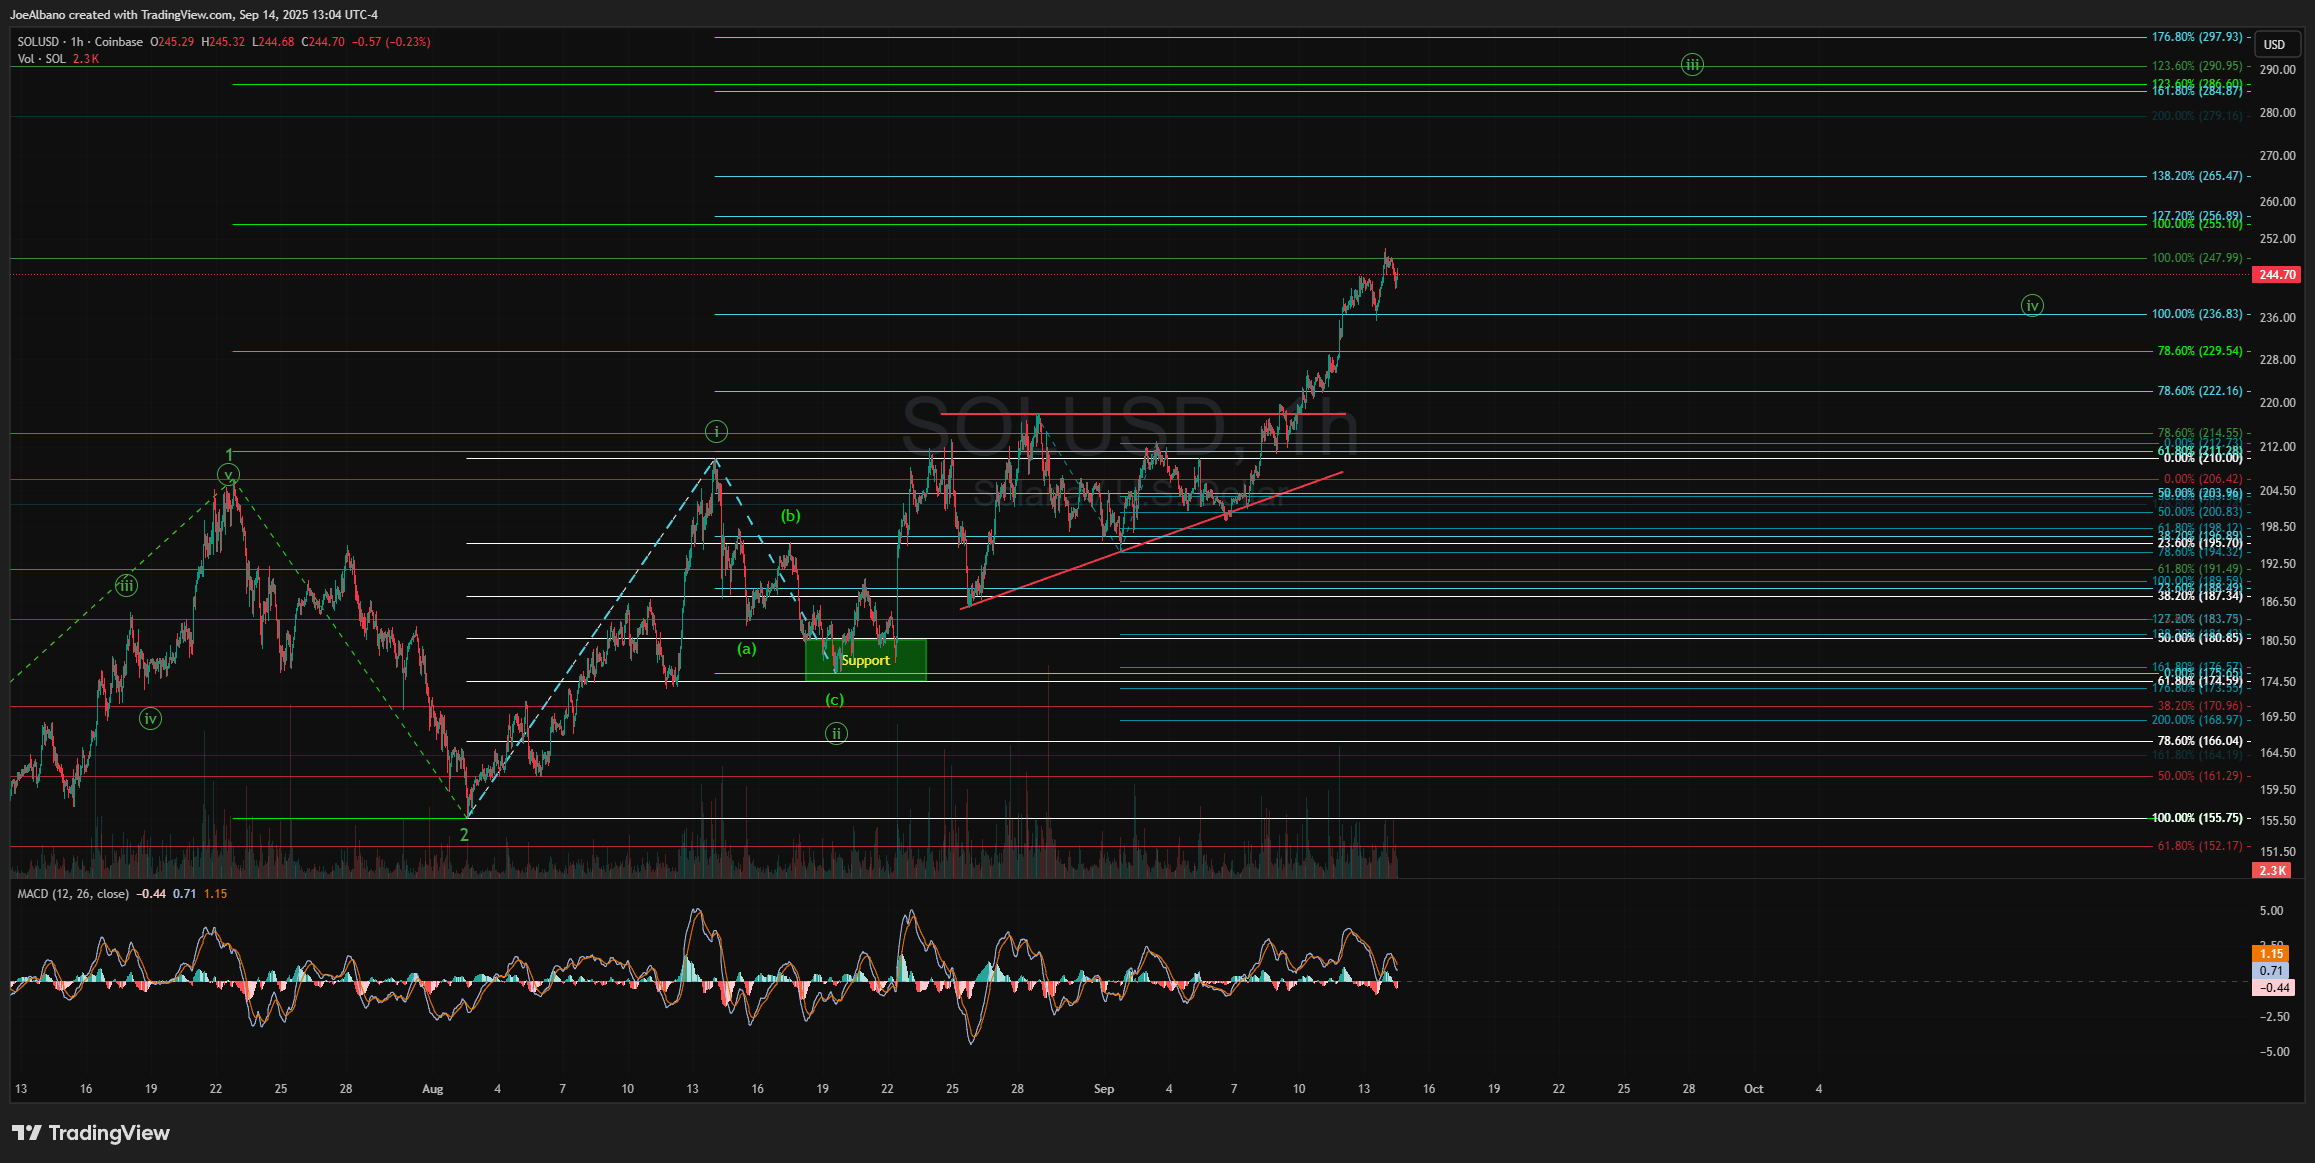
While the count I have below for Solana was my primary, I had an alternative count that assumed the move up from the green support box was corrective and was only forming an expanded B wave before one more low. It was a bit too overlapping to consider it a good signal of the coming breakout. This is when I saw the ascending triangle, which usually indicates a breakout to the upside. This made me have some more confidence the setup was still working toward a breakout.
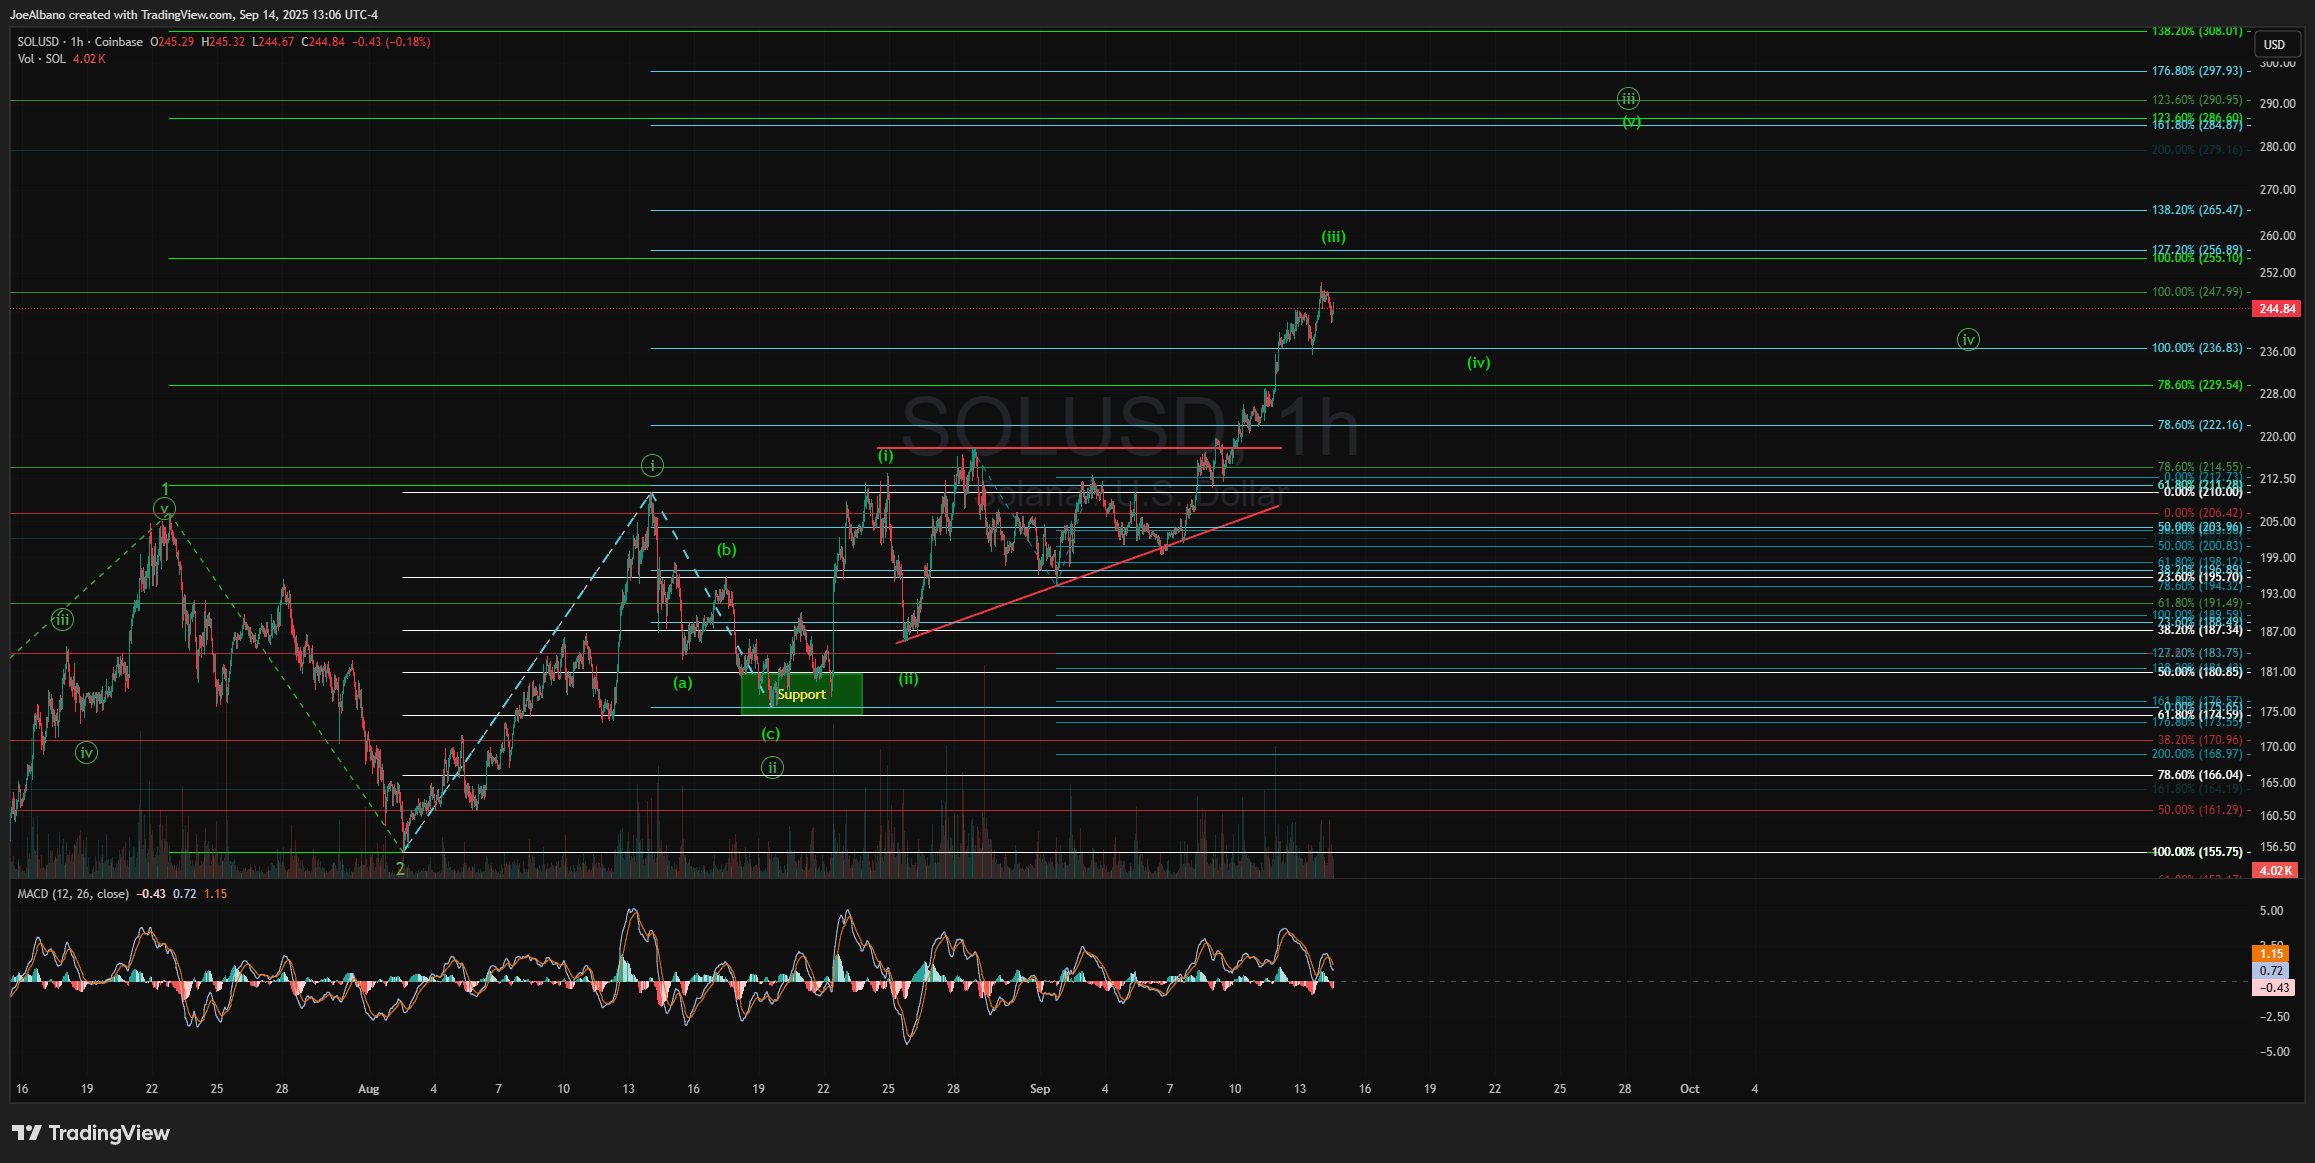
With the breakout now confirmed, the next upside targets and how we get there become essential to guide us with follow-through. With the Saturday overnight move pushing us to the 100% extension of waves 1 and 2, we look for the completion of wave three of circle iii. However, there is more confluence at the 123.6% extension (and also a legitimate target of a third of a third wave). There, the circle i and circle ii extensions (shown in blue Fib levels below) reach the 161.8% extensions for the circle iii wave - a textbook target at that degree.
So, there are a few levels to keep an eye on. First $255 as it's the 100% extension and the base case for EWT textbook extensions. The next level is $284, as it represents the 161.8% third wave of the current degree and the 123.6% of the next higher degree. It isn't unlikely we'll see a pullback at the 100% extension before moving higher, as that is the target for the even lower-degree third wave. Something like this, showing the ((iii)), ((iv)), and ((v)) waves:
If we somehow see a move back to $211, the bullish setup becomes jeopardized. Remaining above that, I'll continue to see the waves play out as I have illustrated in the charts above.
In the bigger picture, Solana is targeting around $500 in this bigger third wave, and around $418 in just the third wave of this larger third wave.
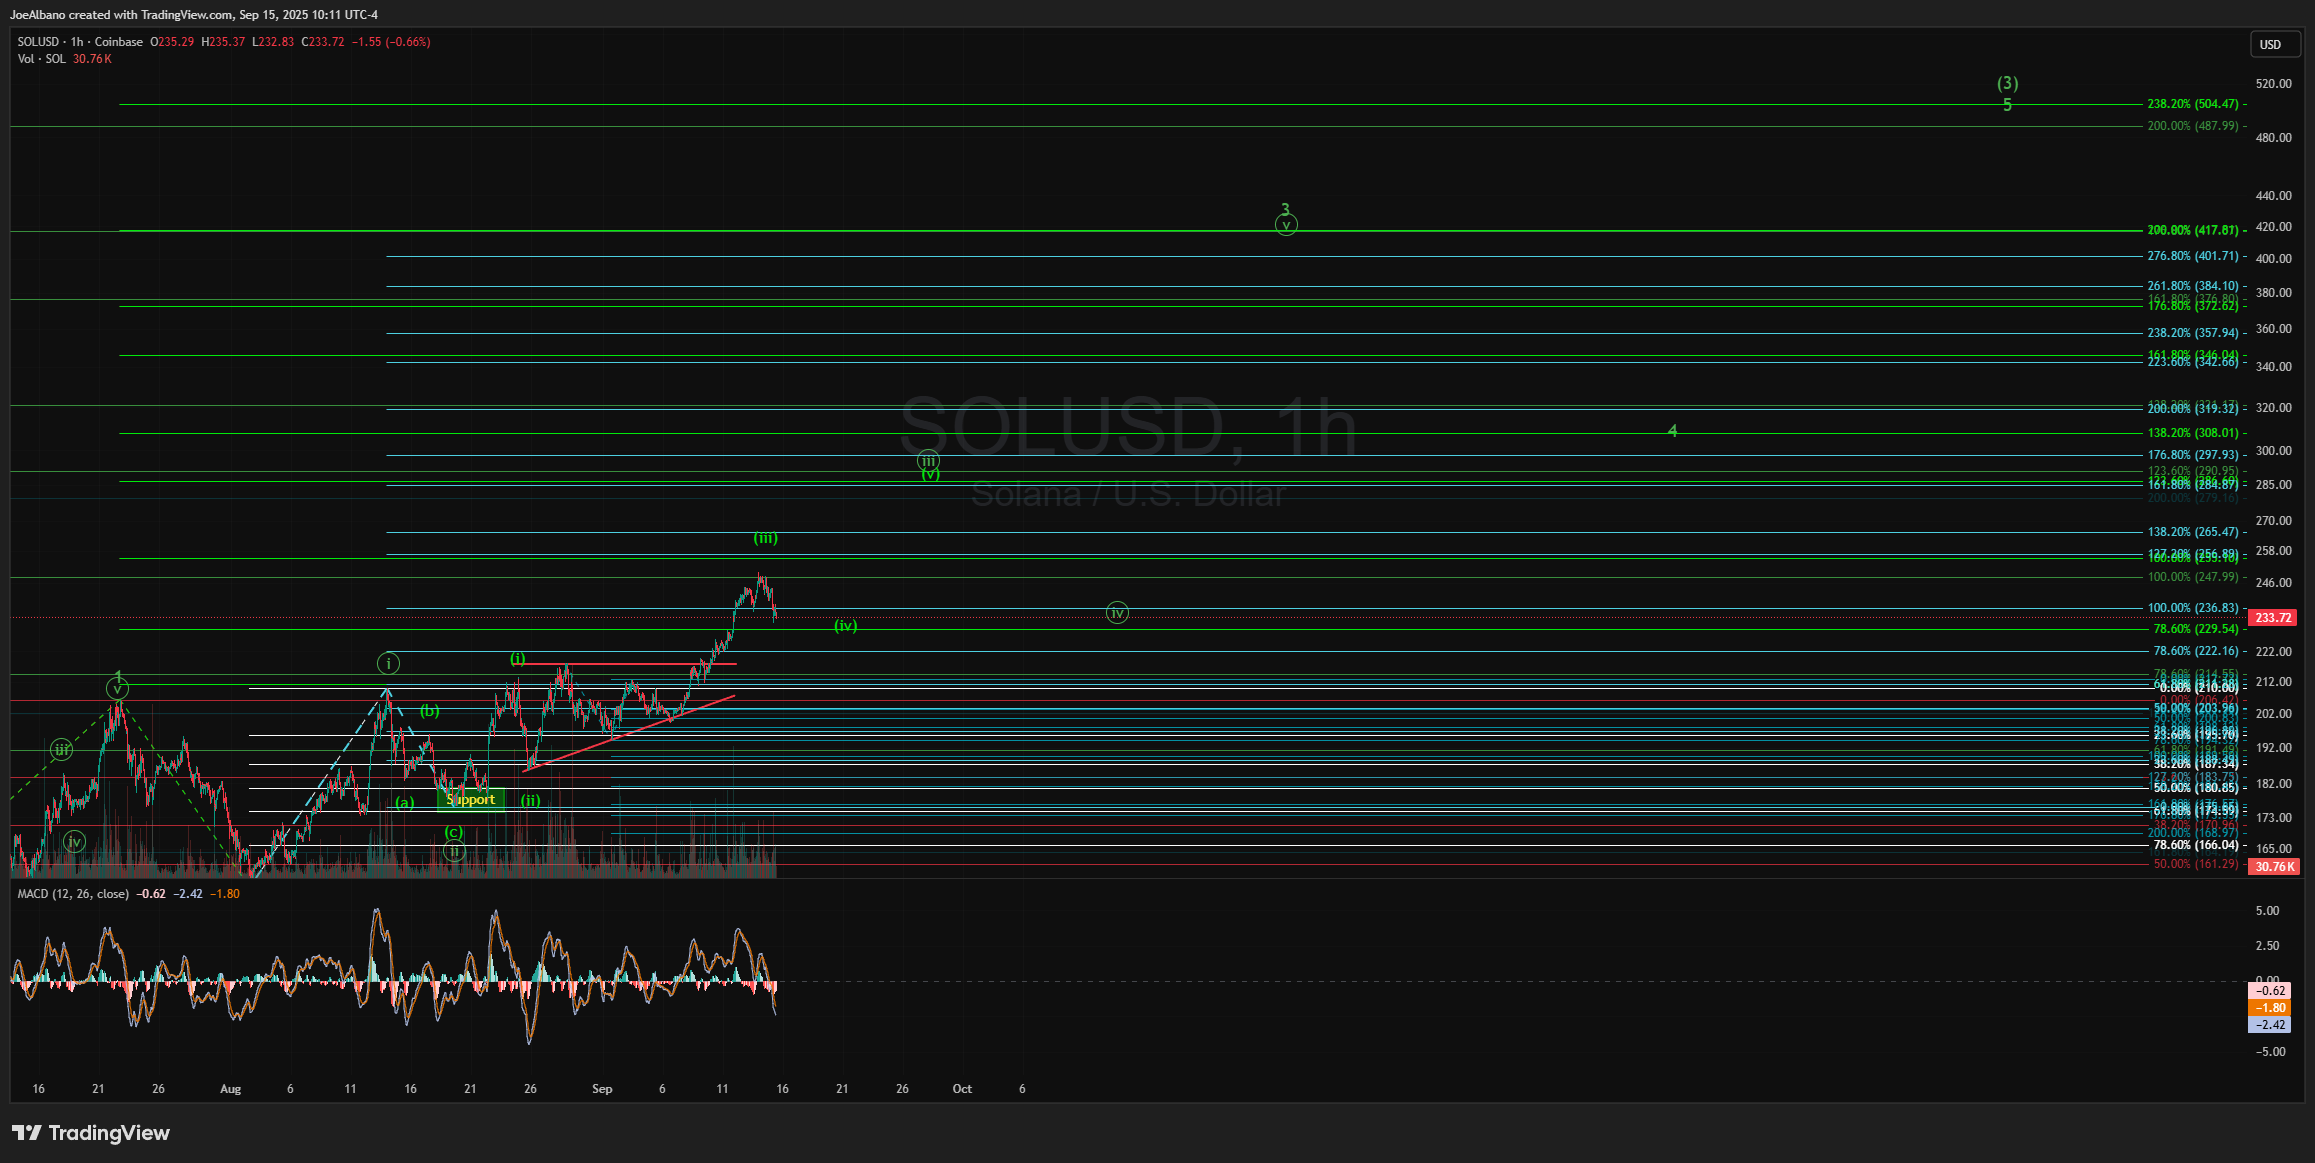
When I compare this to Bitcoin’s potential breakout I analyzed three months ago in its bigger picture, to around $176K to $211K, Solana has the advantage in terms of returns. As my Bitcoin post title indicates, I expect Bitcoin to double from where I had it pegged in June.
From Diamonds To Digital Doubling: Bitcoin's Last Hurrah (For A Bit)

Over the past few weeks, I’ve shared with you a few stocks with potential to buck the volatility of the market over the next several months (or longer). Most of these stocks are running under the radar of investors and traders, adding a layer of obscurity, were it not for my analysis and publications. While those stocks continue sitting pre…
But as you can see in today’s post, Solana is set to rise as much as 185% at the wave (3) target and even 140% in just the intermediate target, outpacing Bitcoin by a wide margin on this next crypto rally.
So, I look to Solana in this next rally I expect to take hold into the end of this year.