

Rubrik Stock Alert: Why an Earnings Dip May Set Up a Powerful Breakout
What I'm Watching: Rubrik may have one more lower low in this consolidation, but it sets up the rally I've been waiting for


With earnings less than a week away for Rubrik RBRK 0.00%↑, things are about to get interesting. The stock is known for volatile moves after earnings, and I don't expect this one to be any different. In fact, the stock could be exiting its consolidation phase and looking to make a move higher in the weeks and months ahead. However, I don't have good confirmation it's imminent, at least not yet.
Two Thursdays ago, in my bi-weekly Zoom session for subscribers, I outlined Rubrik's potential for breakout using the resistance zone I outlined on the chart. Check out the minute video snippet from that session below to understand why that’s resistance and what it could signal if it moves through it.
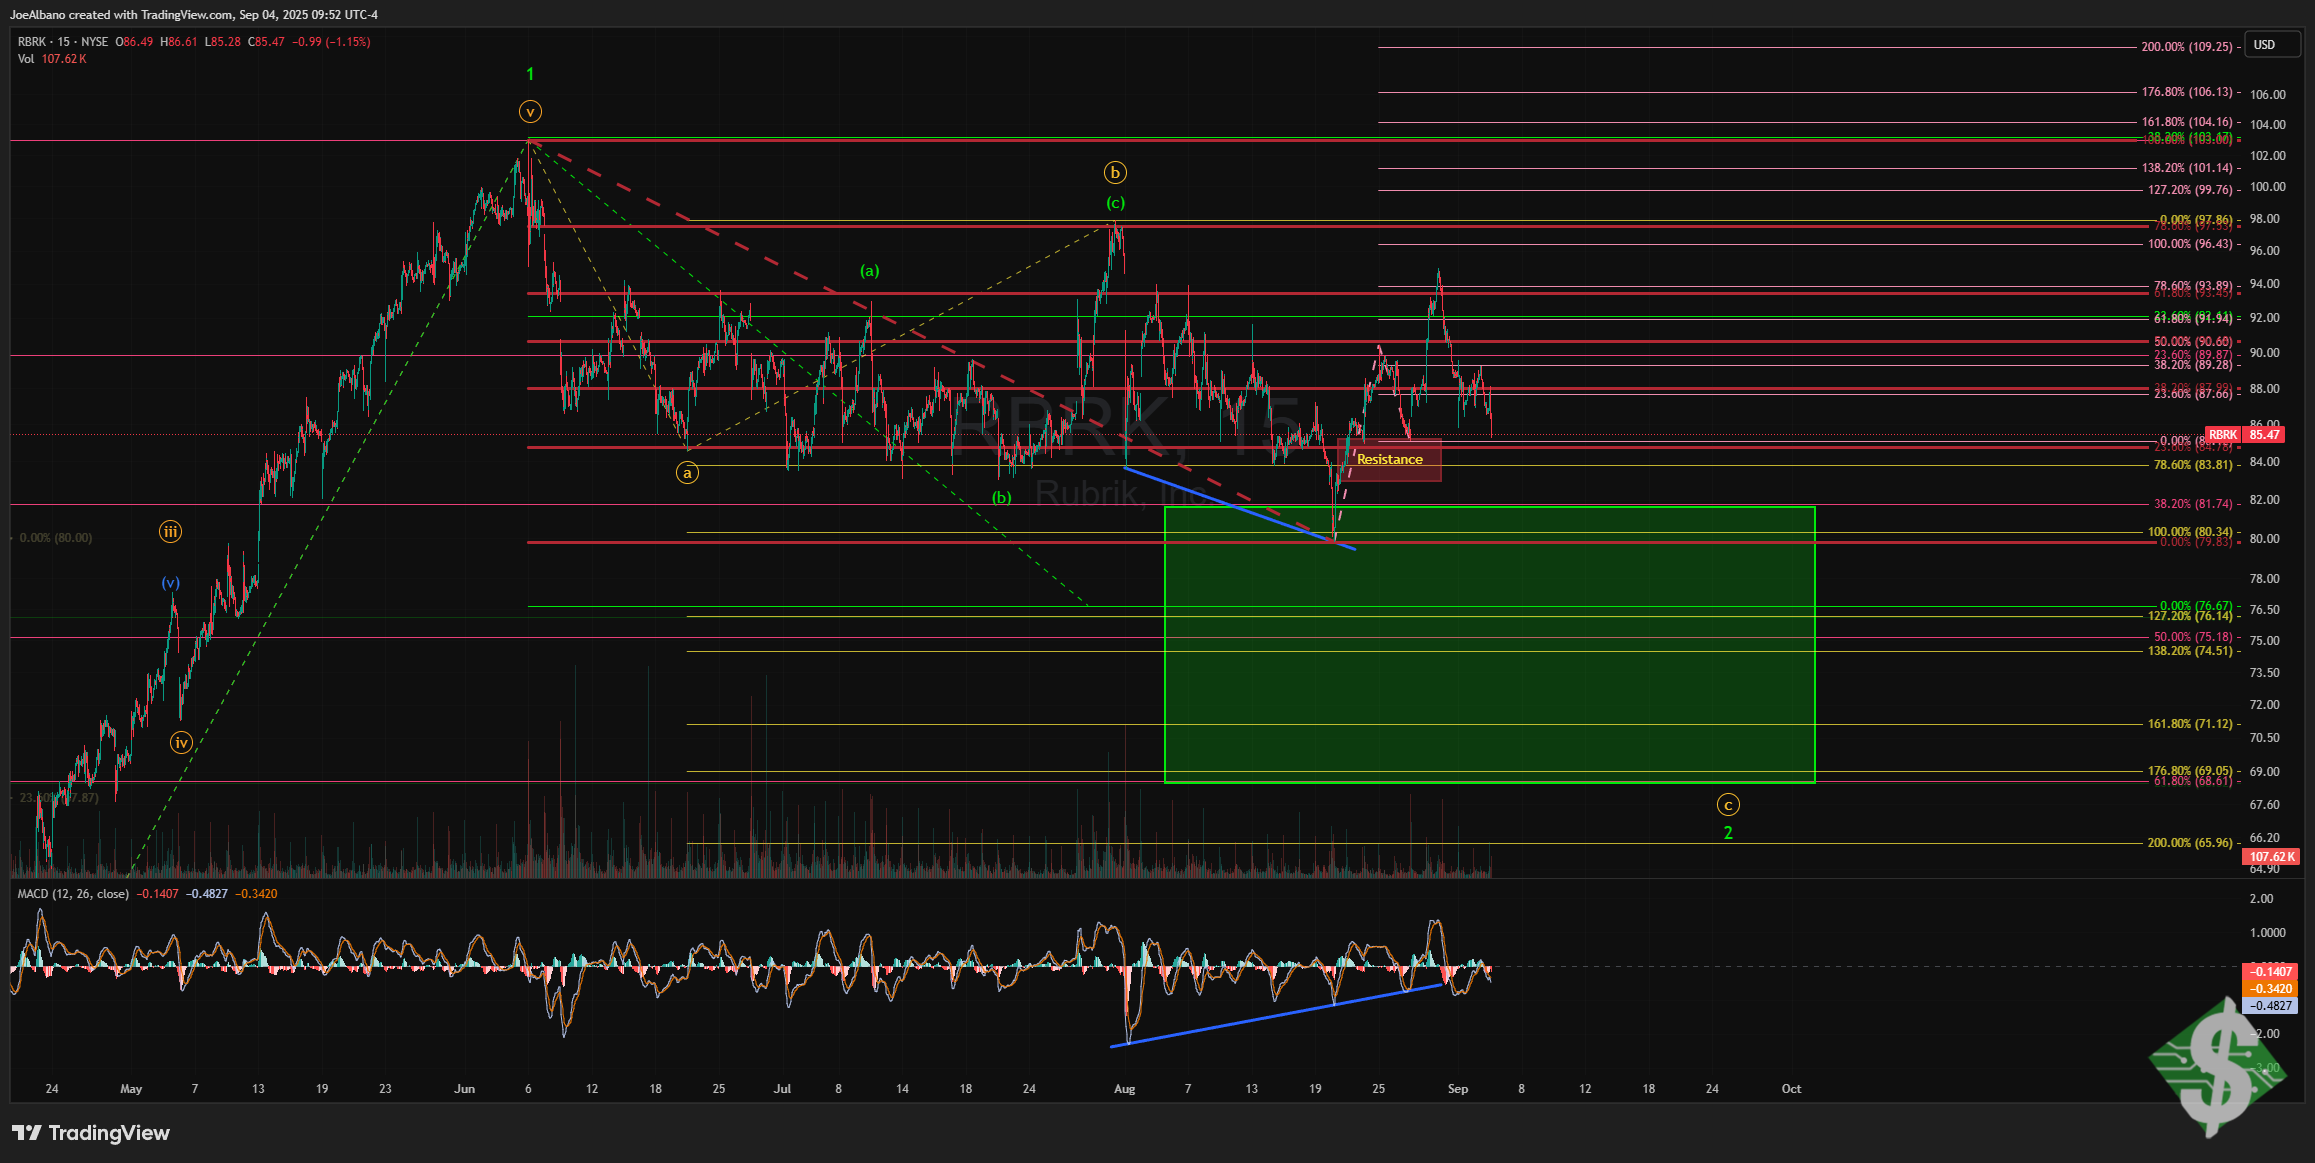
Fast forward to now, and the stock has not only moved through it, but tested it and put in a higher high. But this alone isn't enough to confirm the breakout, as it appears to be only three waves thus far. However, it does signal a near-term bottom was put in place. Moreover, the MACD divergences continue to build, signaling a breakout shouldn't be much longer.
That being said, the three waves up so far don't provide the signal the correction of wave 2 is complete. While it has hit the first target of completion for a second wave (38.2% retrace), and the circle a, b, and c? also hit their target of the 100% extension, the signal the rally is on remains inconclusive.
This three-wave move up through resistance could be foreshadowing an ongoing wave 2. In this scenario, it means the recent bottom the stock found was really the A wave of 2 (circle a), and we're now completing wave B of 2 (alt circle b). This is shown by the yellow alt in the chart below.
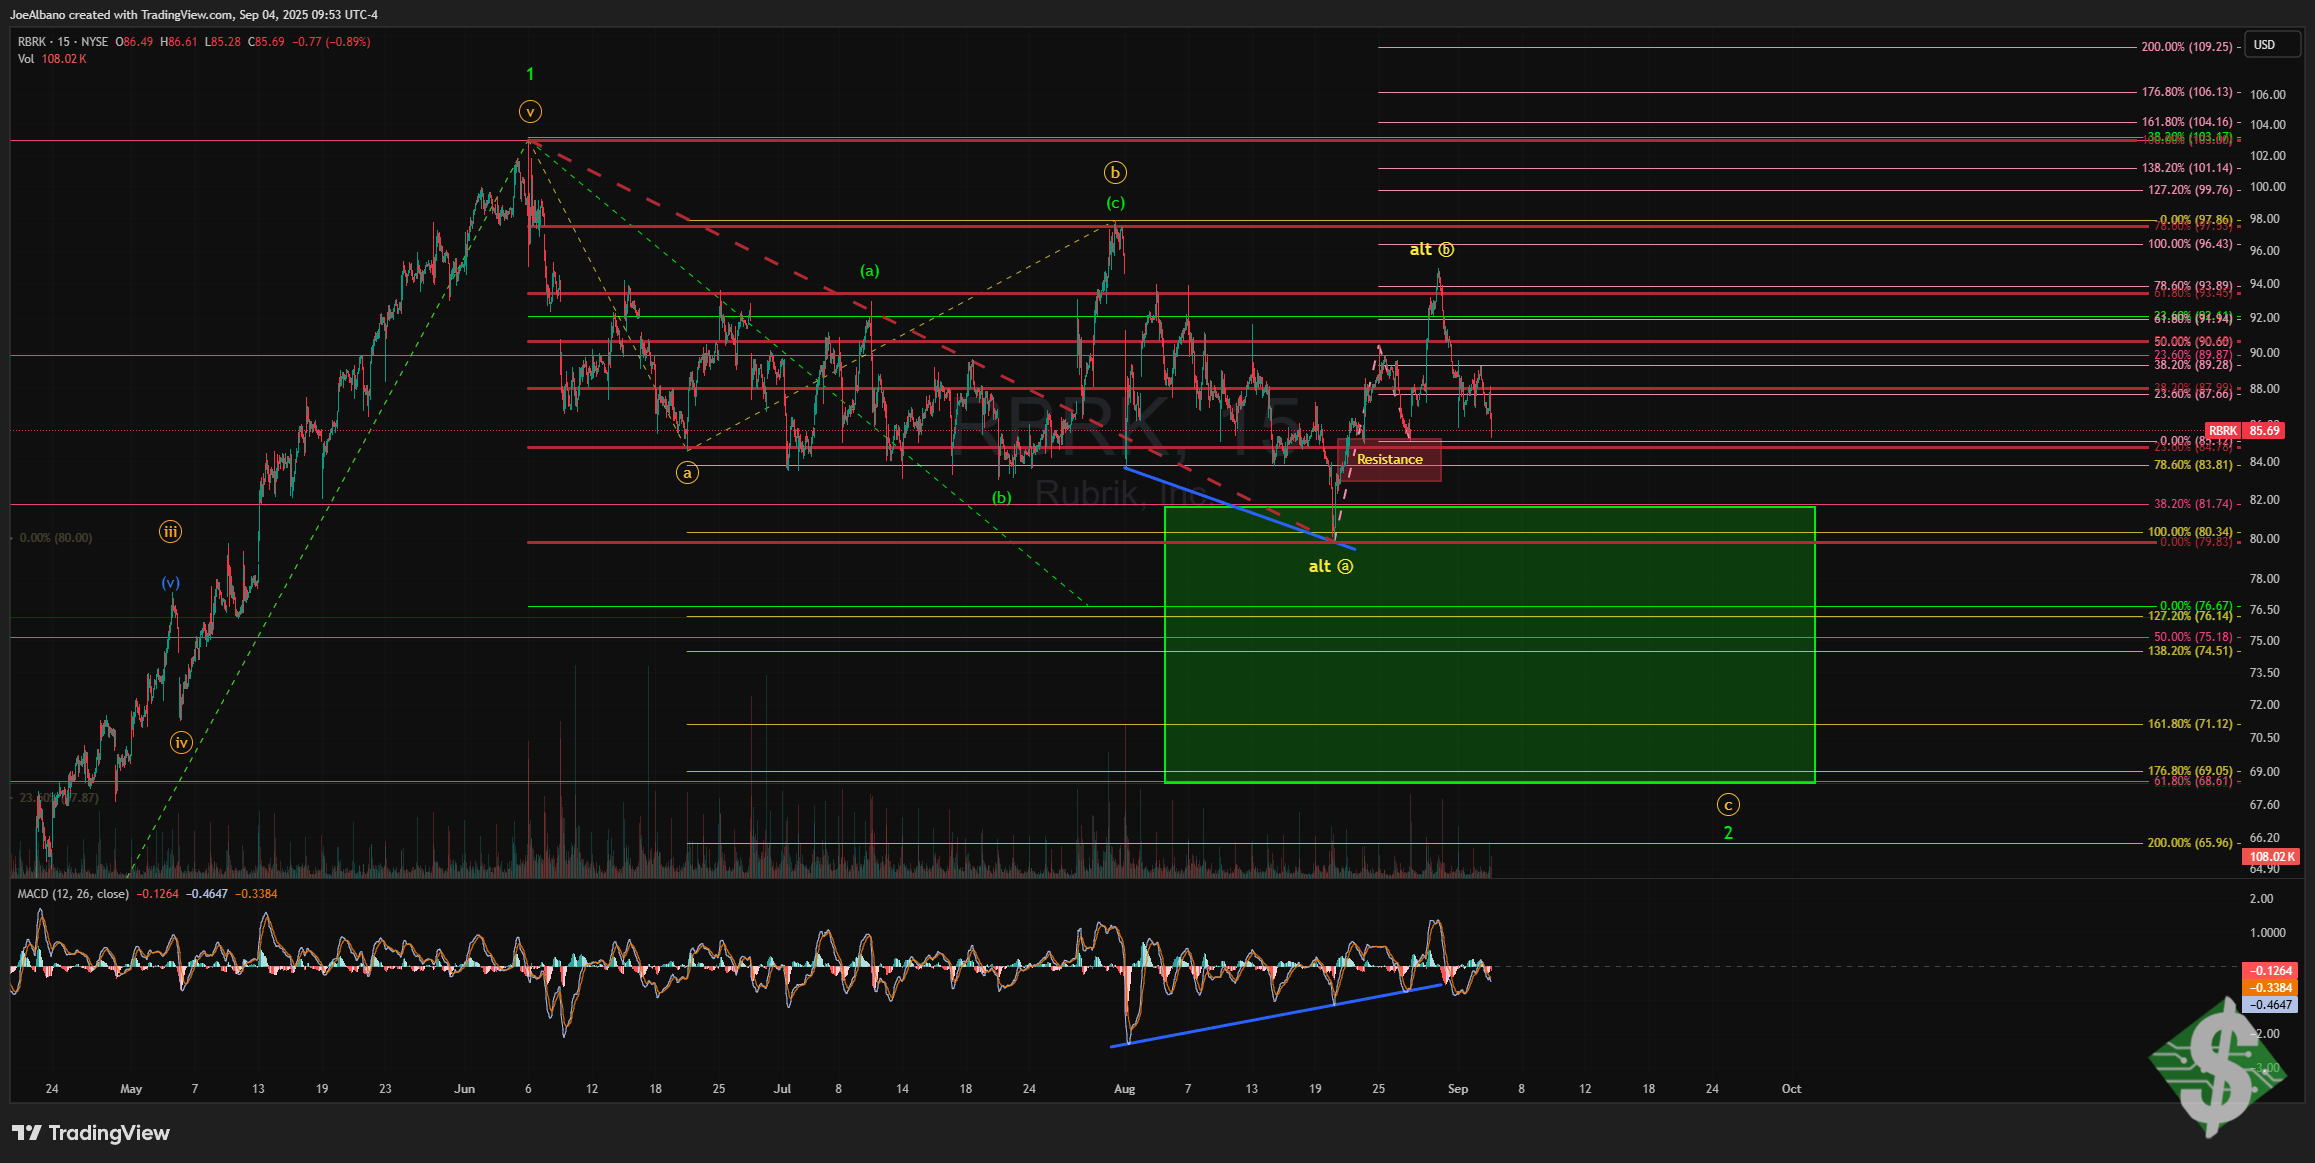
If we get a five-wave down move in the coming two weeks, it'll confirm we're in the circle C of 2, and we'll have a nice, much lower entry waiting for us to go long. If, instead, it pulls back in three waves, it can either be an ongoing structure for wave alt circle b or a sign the rally is actually coming together for higher. Right now, I lean toward new lows until proven otherwise. Given the MACD divergences are on the 15-minute chart, it would have foretold this bounce we got in the last two weeks, and not the bigger rally I still expect to come.
How do you think about it now, after earnings move to the lower side. It appears to me it is following your wave pattern perfectly.
Continuing to fall, now $74.20, no signs of a bottom yet