

It’s Not Over For Oracle
The bounce may feel like relief, but know what the setup is saying


It’s Not Over, In Terms Of Pain
After rallying into a historic earnings report in September of last year and then plummeting in the days and weeks after, some have likely found Oracle’s ORCL 3.84%↑ April lows and subsequent rally to be the relief they were hoping for. Unfortunately, it was likely only a pit stop on the way to further lows; a B wave bounce. After all, after completing an ending diagonal, it’s typical the price returns to its origin of the diagonal and in a fraction of the time it took to form the diagonal. That diagonal started near $61.
What the chart shows is Oracle’s decline doesn’t look complete, and if the C wave has just started this month, the target is $97. But this is a baseline target in a typical setup. After an ending diagonal, this doesn’t necessarily hold, and sentiment flushes out hard and fast, exceeding typical targets. Thus, it would be pertinent to set expectations for $75 or $65 as those are the more reasonable targets to expect given the chart’s context.
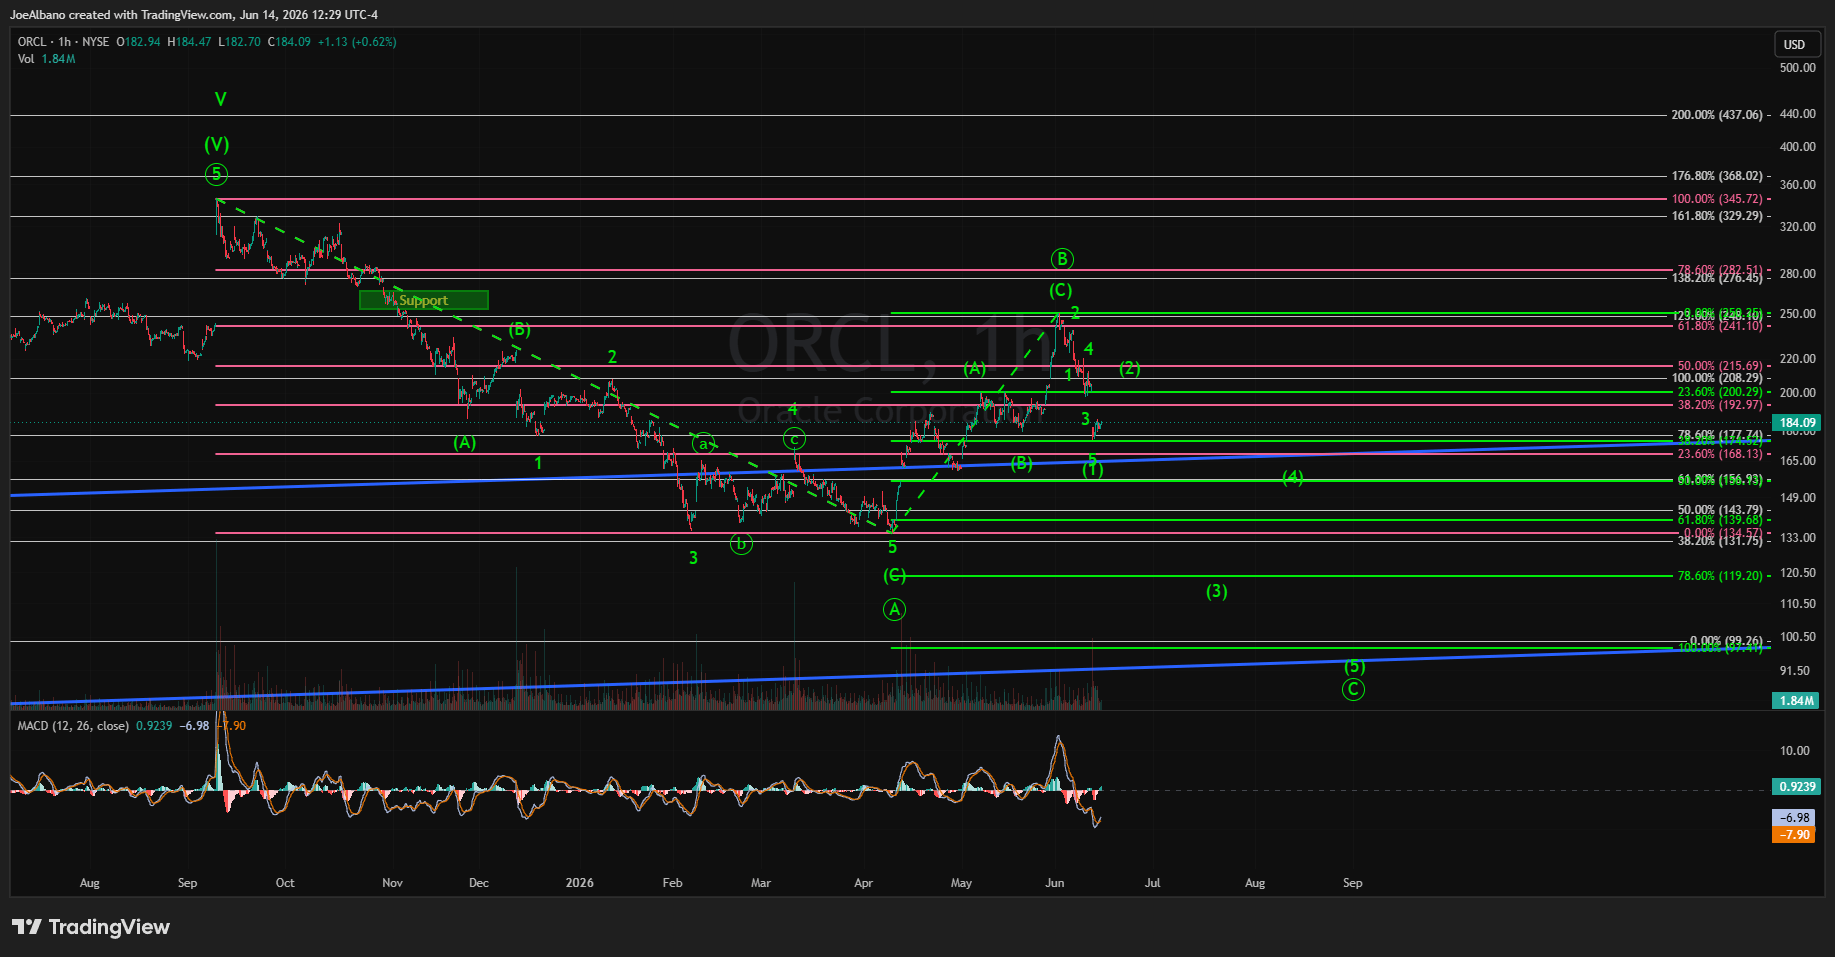
If wave circle C has started, the chart reads as if wave (1) has completed. And, so far, the bounce off this past week’s low looks corrective, fitting it in nicely for wave (2) of the C wave. Wave (2) can find its way back to $200, and even push as high as $218 before it completes. But when it does, the next decline in wave (3) targets $113-$122, depending on where wave (2) ends. At $200, the C wave target of the A and B waves aligns with the 200% extension of the C wave’s internal five-wave structure around $97-$98.
If I were long Oracle, I’d be extremely cautious here. Any three wave bounces keep the sell off intact and lower targets the most probable.
Don’t Miss Calls Like This
Paid subscribers are getting my best analysis week in and week out, and Oracle is just one example of knowing where the chart is headed. Don’t miss the next setup, of which there are several right now.