

Micron Minute: Knowing When The Chart Is Saying Something Else
Adjusting to new structures is how one stays ahead, with still enough time to act

It’s no secret I’ve been saying over the last several weeks the risk for Micron MU 0.00%↑ to have topped or be topping is high. The bigger picture on the chart is reaching its peak amplitude, and a parabolic move never ends well. But I’ve always held out the question of, where does the parabolic move end? If it’s going to reverse, it first has to stop moving higher. But until it does, it can keep pushing further. It sounds redundant, but it’s important to analyze the first step before the next.
The difficulty is tracking a parabolic move as it can extend well beyond anyone’s expectations. This is the high-risk, high-reward dilemma the stock finds itself in. It can move hundreds of dollars higher quickly and without coming up for air, but when it does eventually end (and it always, always does), the reversal initially feels like the most magical buying opportunity ever, until it keeps dropping, and dropping. Then suddenly, the sentiment in your own stomach changes.
This is why I’ve been saying keep watching support, keep watching the structure, because until it breaks support and until the structure starts showing three-wave moves up, the stock is likely to keep marching higher unimpeded.
This brings me to this week, where the stock has not only held support, but also made a new high. I now have to consider what the new high means.
One conclusion is it can simply be an expanded B wave within the correction I’ve already been tracking. And right now, that is the better count because there have only been three waves up, even though I could argue for five up. Moreover, the action on Wednesday adds to the idea the C wave has started.
Another conclusion one could reach is this was wave one of the next rally (in other words, the five up argument), and we’re in wave two of it as of Monday. If so, it should hold the yellow support box. At this point, both the ‘(ii)?’ and the circle c would be five waves down. But (ii)? would hold $944 (if it gets there at all) at the 61.8% retrace, while the C wave wouldn’t. This is why the yellow box makes the difference.
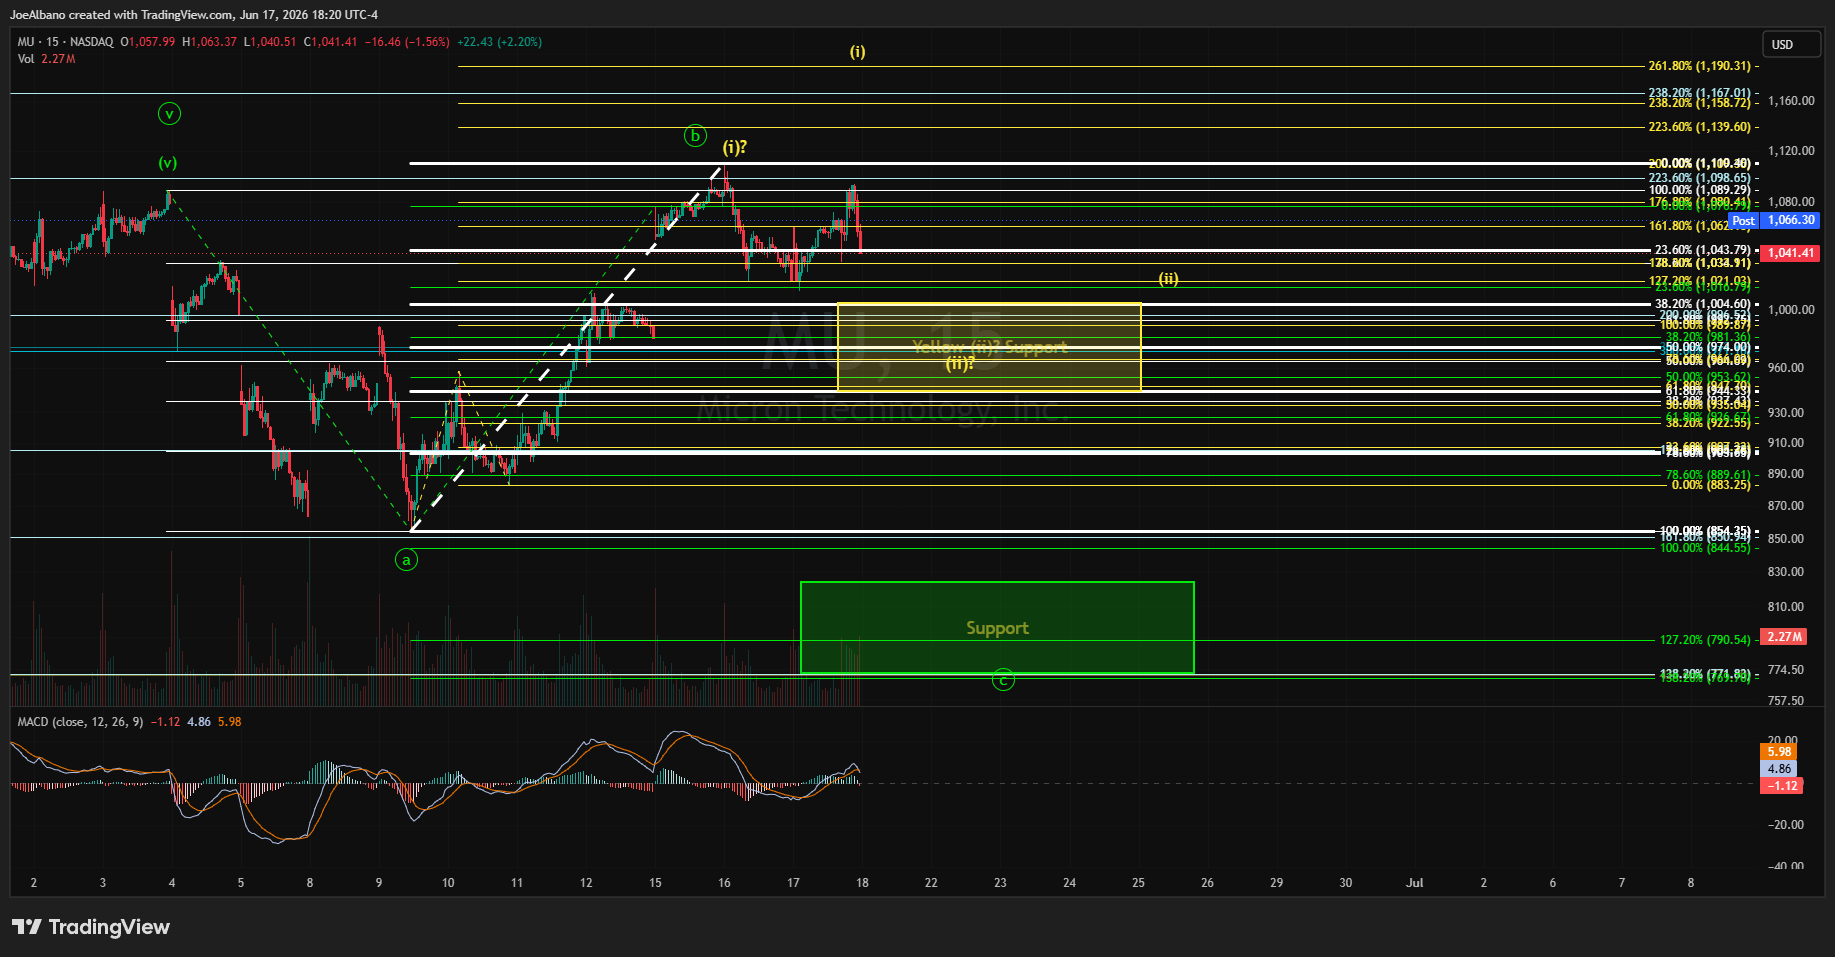
The bottom line is, we’re heading into earnings with a pretty mature setup. The question is which one is it? In either case, I expect us to head to the yellow support box before earnings, as both counts have the same path at least to there. With earnings acting as a large catalyst for movement, the question that remains is whether it falls through the yellow support box on the reaction and heads to the green support box, or if earnings shows us the yellow count is the one by a strong move off of support and toward wave (iii) into all-time high territory.
Those of you who are aggressive in their positions can enter a trade before earnings (so long as the yellow support box isn’t broken), while those who are more conservative can wait for the post-earnings move. The latter would still present plenty of upside as the third wave targets $1,500, and I don’t expect earnings to make that all up in one day.
Those of you who think this is “well, it could go up, or it could go down, thanks for nothing,” miss the point. There are parameters and triggers in place; decision points. You have them now; thus, you can strategize with them.
This is Elliott Wave Theory applied in real-time and how it was designed to be implemented. When the chart shows a different look, probabilities shift, and conclusions change. I can’t stick with something I set out with a week ago when the structure isn’t the same and the market says it has a different idea. The market and the stock price are the source of truth; the structure it creates is the one I work with, not what I want it to be.
I do this for the over three dozen tech stocks I cover; staying ahead of the moves and setting up supports and triggers.