

Micron Minute: A Chart And A Conference Walk Into A Bar
When a chart and a conference walk into a bar, only one of them knows what happens next.


Most people confuse news for sentiment. They think the news predicts what the stock will do - bad news is bad for a stock, good news is good for a stock. We know this isn’t true just by how many instances a stock rallies on “bad news” and, similarly, how it plummets on “good news.” News, events, earnings, and the like can be catalysts, but they aren’t sentiment reads. Two different entities, and they shouldn’t be confused.
We have another setup like this playing out for Micron MU 0.00%↑ next week.
The catalyst is Micron’s attendance at the J.P. Morgan Global Technology, Media, and Communications Conference next Wednesday at 8:40AM ET. Now, you might be wondering, “OK, companies attend conferences all the time.” While that’s true, Micron tends to use these conferences to update investors on the quarter, and because Micron is such a technical company in a market-priced industry, gold nuggets come out of these conferences. Sometimes, management uses the events for pre-announcing earnings, but it’s hit or miss whether management takes the opportunity.
Nonetheless, these conferences build in some expectations. The market could expect a preannouncement, but not get it. But this alone isn’t the factor. If sentiment was reaching a peak going into the event, it could sell off. On the other hand, I’ve seen positive preannouncements get sold off just as much, if not more. It’s not a logical equation to be solved.
This is why looking at where sentiment is ahead of a catalyst is important. It’s not about the content of the news; it’s about where the chart is going into it. And this doesn’t mean “Oh, look, it’s at highs, it’ll drop on whatever happens.” The context of the chart matters as much as knowing where it is in the bigger picture. A rally can be met with another rally, and a selloff can continue down further.
If you’re saying, “That’s not very logical,” you're likely the only person you know this close to understanding how the markets work because they aren’t logical; they’re emotional.
And if they are emotional, trying to say “a preannouncement will boost Micron" next week, can’t be relied upon. It may turn out to be correct Micron rallies on a preannouncement, but sans sentiment analysis, you’ll be right for the wrong reason, which is far more dangerous than being wrong.
So, what happens when a chart and a conference walk into a bar? They realize they have nothing in common. But for us, it’s still possible to understand where Micron is likely to move.
As it stands, less than one week from the conference, Micron is still maintaining all-time highs. It has taken a small breather but continues to hover just under the highs set earlier this week. With a few trading days leading into the conference, a conference where we know nothing about what’s going to be said, is it possible to understand where Micron moves to, if it moves meaningfully at all? Yes, it is possible.
But it’s not possible in a crystal ball kind of way. It’s possible to distill the chart down to what the highest probabilities (counts) are, with clear levels to know when which count becomes the most probable, leading to a reasonable understanding of the risk and reward to make a trade decision.
The difficulty with Micron is it is in a larger pattern known for unreliability and blow-off tops (a diagonal) - like what we’re seeing over the last several months. This, in and of itself, is a larger context clue on what to be aware of from a risk perspective. It does, however, make analyzing these future moves more precarious from a probability standpoint.
Nonetheless, it comes down to what I wrote about last week, of whether this is “all” of the rally in one direct shot, or if there’s going to be a much more bullish setup, and this is only wave one of five. In either case, we’re going to look higher until support starts playing a role in the movement, first to where a second wave typically lands. The only other option is Micron has topped. To this point, there’s no confirmation of topping, so I’m not claiming it has topped by any stretch, but this is called risk management.
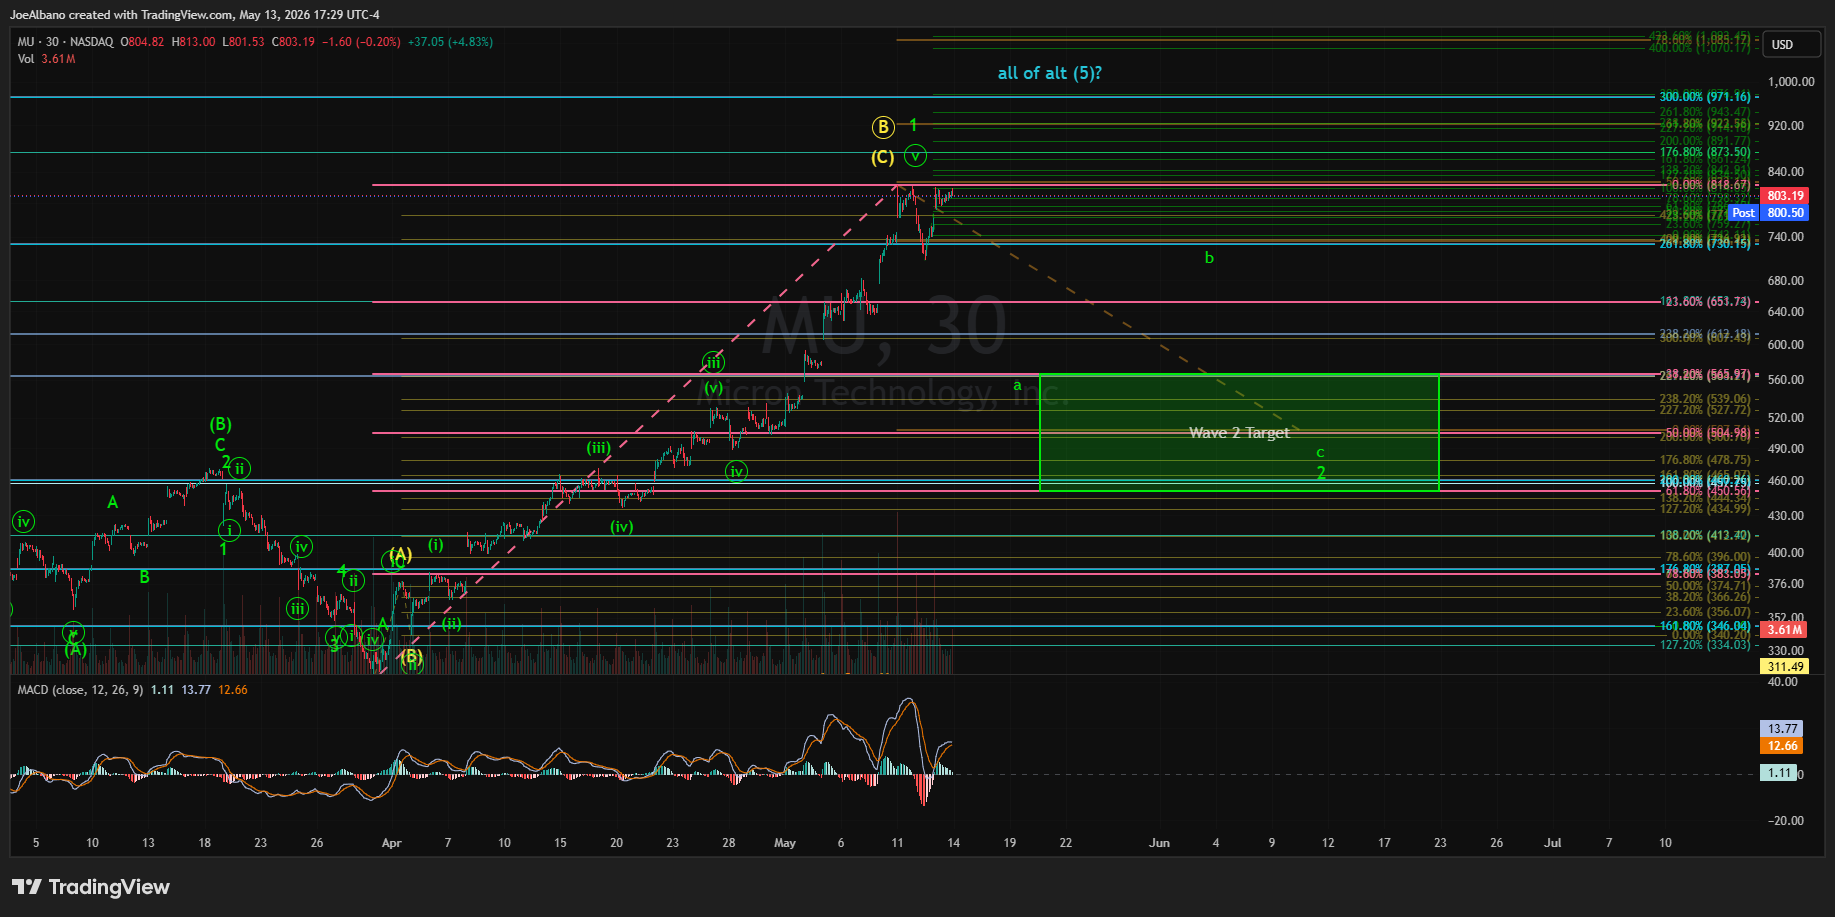
The key point for us to see a more predictable wave setup higher is for a second wave pullback. This would need to land somewhere in the green box in the coming weeks and months, and do so in a three-wave structure. If it does, and it shows five waves up off the low it makes in the box, we will be seeing some $1,000+ targets shortly thereafter. If, however, it moves through the green box and continues lower, a top may be in place for some time, with the potential for the entire rally to have completed. Only my yellow count leaves an opening for a rally months down the road if it breaks the green box, but it comes after a steep move back into the $200s.
Overall, the stock hasn’t tipped its hand yet, and the higher it goes directly, the more uneasy I get about the probabilities of the wave 1 and 2 setup playing out for much higher down the road. But we have the support levels and the idea it can keep going higher with no pullback, so our plan is clear: wait on support. The negative is moving directly higher gives us an instant gratification situation, whereas the 1-2 gives us a better but delayed one.
Why do all these posts sound like AI drivel