

AMD Beginning To Clarify Its Intentions
After a strong rally and a corrective pullback, there's just one missing piece to the chart I'm waiting on to determine which of the three scenarios will play out.


AMD AMD 0.00%↑ has a lot to look forward to over the next year. It has its first true, complete rack system for AI acceleration on the way. It has a few relatively large deals compared to its recent AI revenue to begin collecting on. And it has the ongoing war being won with Intel INTC 0.00%↑ in the CPU market. AMD fundamentally looks pretty well situated, just as long as execution goes according to plan.
But on the chart side of things, there are still some question marks. Those question marks, however, are beginning to be answered. We need just a bit more price action to fill in the gaps to put a more probable (and tradable) count on the chart.
While I’m tracking three counts for AMD, the two I’m most concerned with right now are green and yellow. Right now, to discern which one is playing out, we need to see what the next move higher looks like. If it moves higher from here and gets stopped between $236.50 (or under) and the $250 area and reverses into five waves down, then the green count is what is happening. This would be the quickest bullish scenario, but not the most bullish in terms of later targets higher.
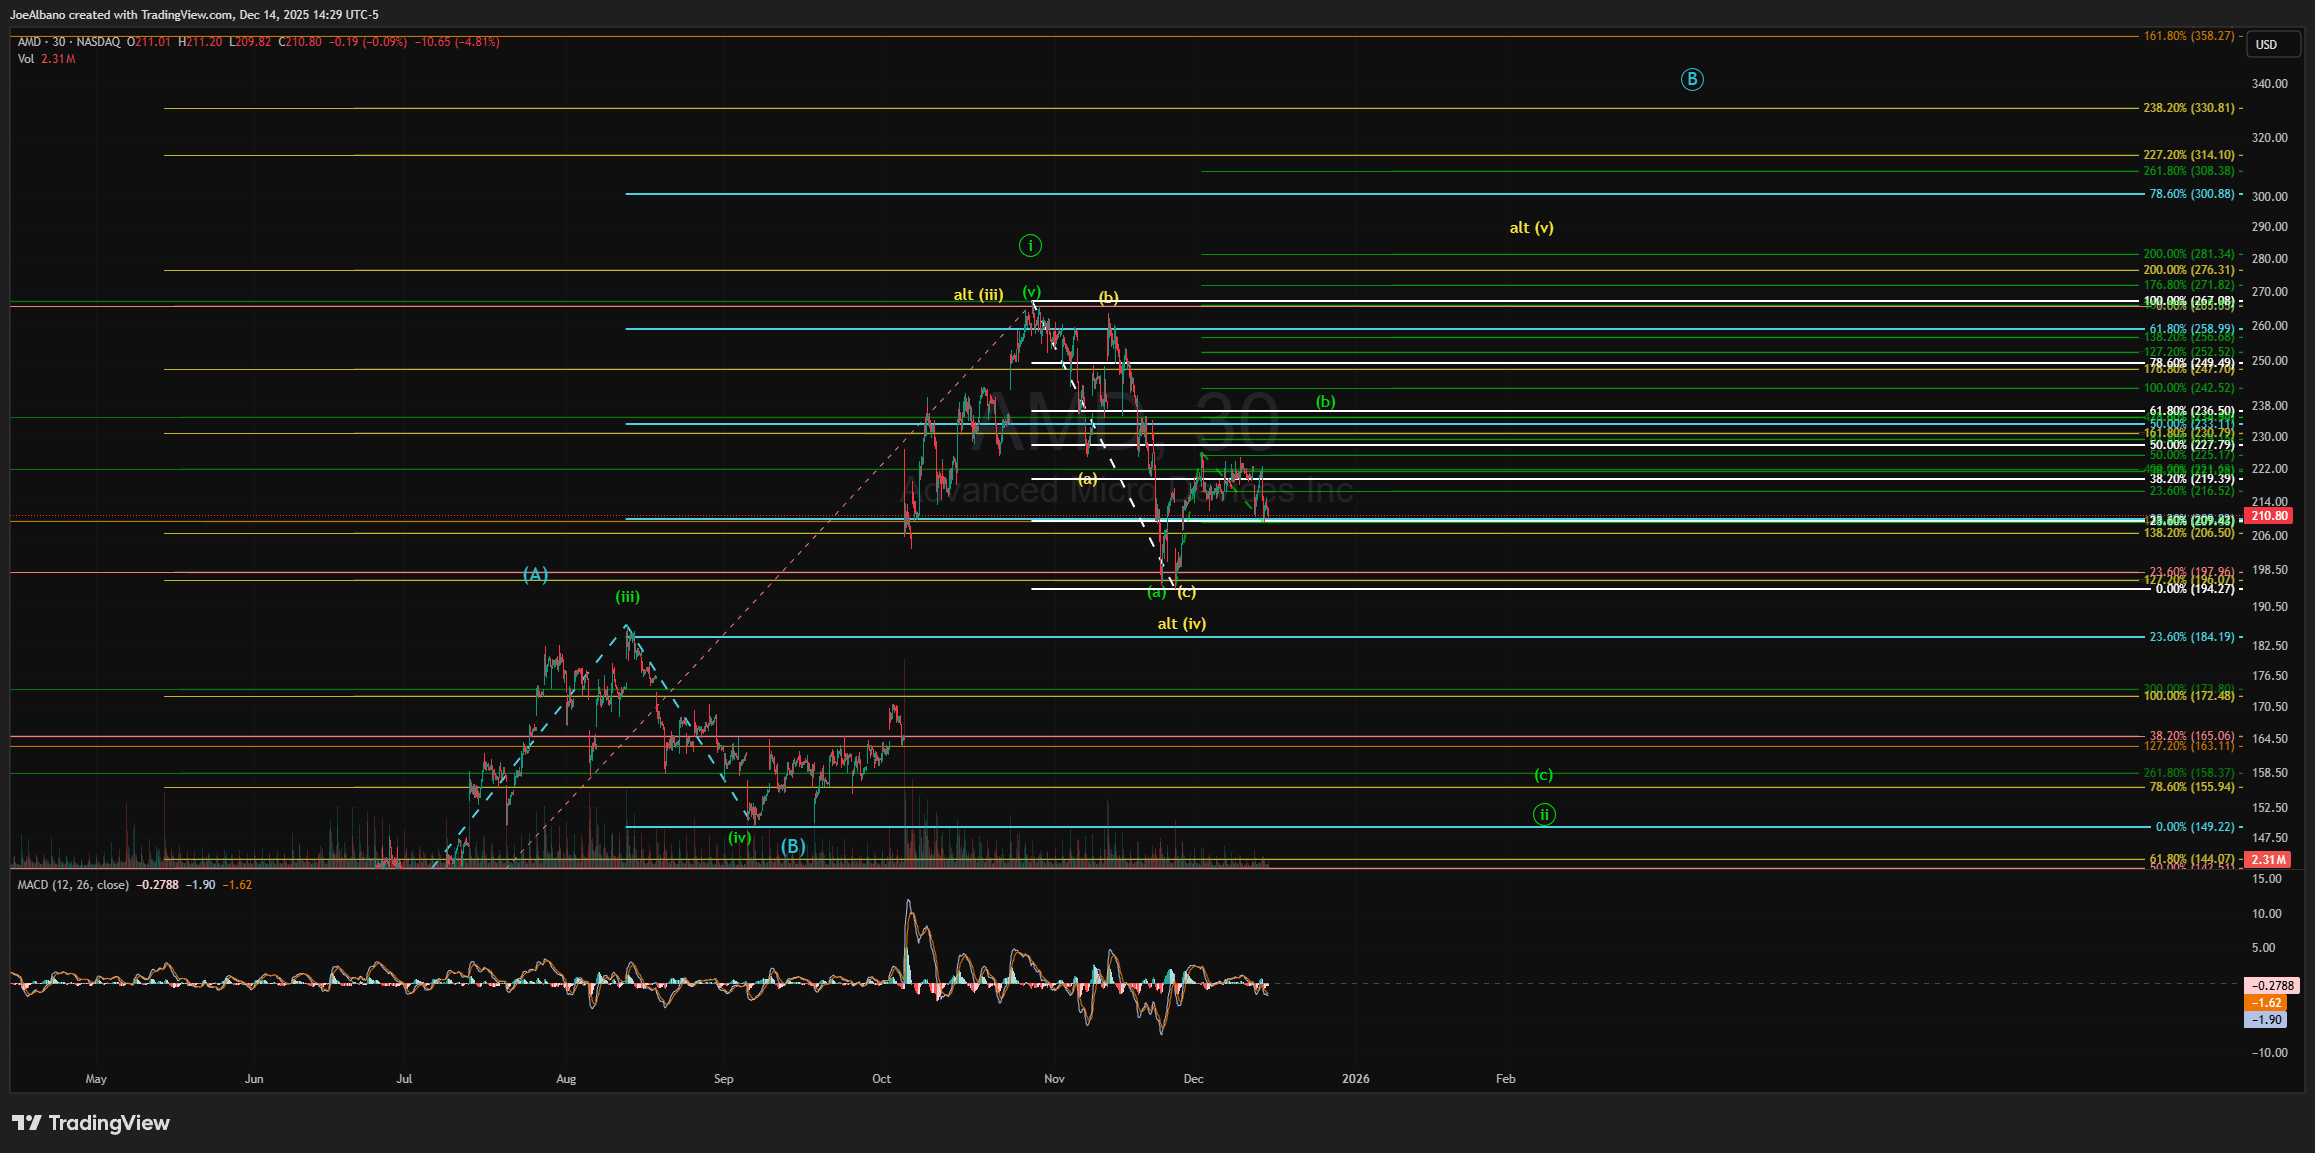
If instead, we see a move above $250 and a three-wave pullback after the high it hits (whether at $250 or above), then the alt yellow count is what is playing out. In either of these situations - either green or yellow - the medium-term is still bullish as both indicate the new rally is underway and it’s just a matter of what part of the count we’re in.
But, should we get a rally to new highs and then a five-wave move down, the teal count is what I’m tracking. This one looks to be low probability as it’s not only an expanded B wave (more difficult to track), but it also requires forcing some counts over the last year. In other words, its structure isn’t the cleanest and clear enough to give it a high probability.
Here’s what the bigger picture in that count looks like:
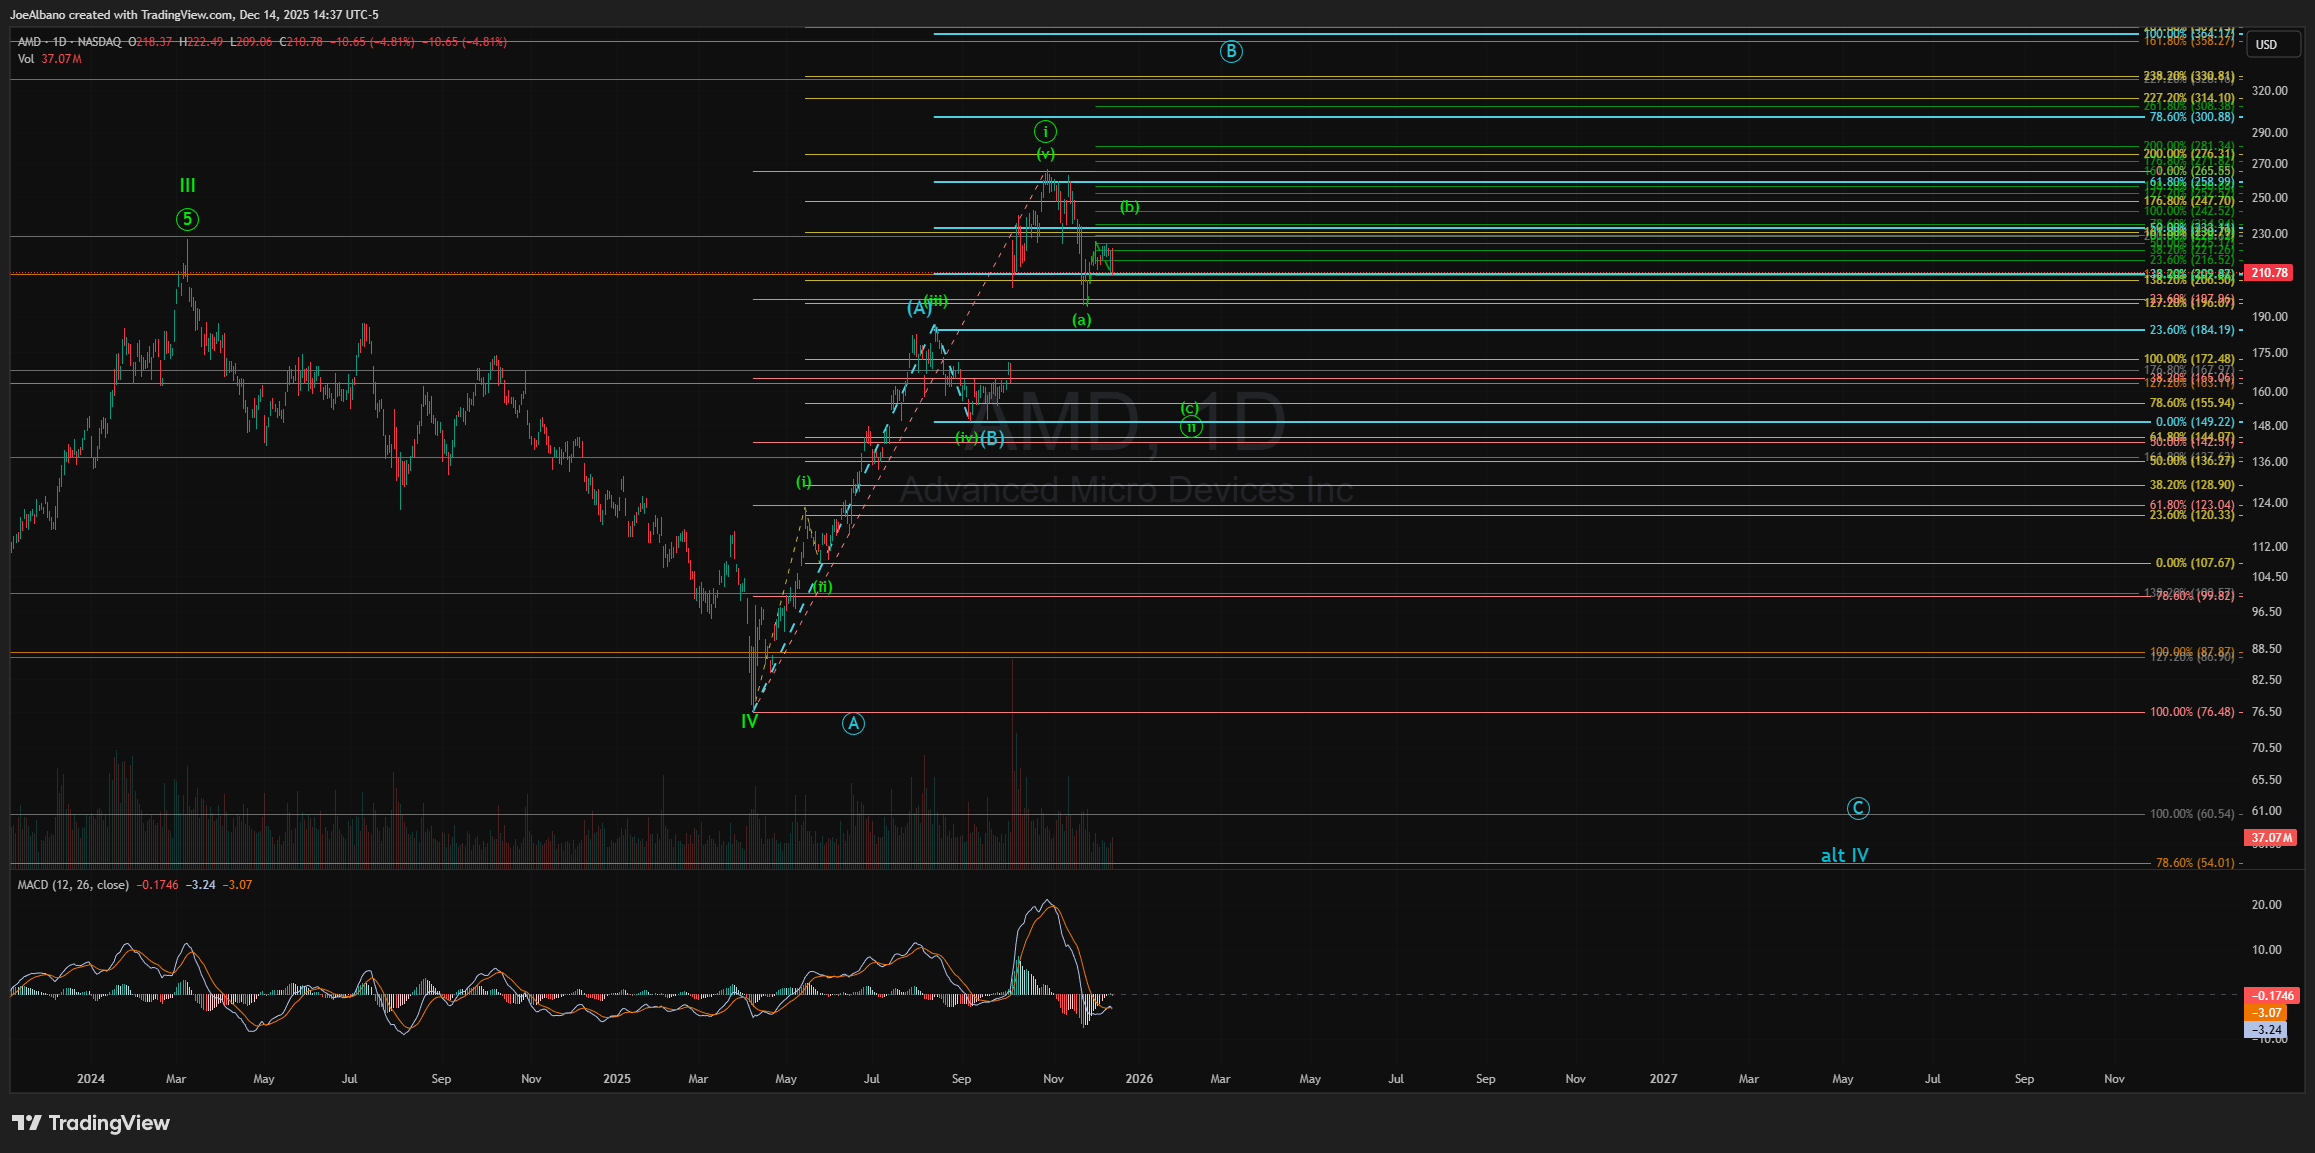
Again, it’s much less likely, and we’ll see it playing out before we begin breaking down to such low levels. For now, I’m leaning toward a more bullish year or two ahead, given we hold support levels and structures remain corrective to the downside.
Really sharp technical breakdown. The distinction between green and yellow counts hinges on that $250 threshold which makes sense given how much resistence AMD has faced in prior attempts at breaking through similar levels. What caught my eye is the teal count, even though you label it low probability. Expanded B waves are notoriously tricky to spot in real time and can ruin an otherwise clean Elliott structure. I've been burned tracking AMD through similar setups where fundamentals screamed buy but the chart just wouldnt cooperate until much later.